Resetting the relationship between local and national government. Read our Local Government White Paper
Future health challenges: public health projections - childhood obesity
Child obesity analysis: methodology summary by the LGA Research and Information Team
Purpose
The purpose of this analysis is to produce a set of forecasts at local authority level for prevalence of obesity and overweight among children, at both reception and Year 6. It is hoped that these forecasts will allow local authorities to anticipate likely future levels of child obesity in their area, assuming that trends in child obesity continue in their current trajectories.
Interactive Excel tool download
Download an interactive Excel tool containing the individual projections for each local authority area.
Data source
The data used to produce these forecasts comes from the National Child Measurement Programme (NCMP), published by NHS Digital. These statistics provide local authority level figures for obesity prevalence on an annual (academic year) basis. These figures are based on measurement of the body mass index of children in Reception (aged 4-5) and Year 6 (aged 10-11) in mainstream state-maintained schools in England. The latest available statistics, relating to the academic year 2020/21, were based on a considerably smaller number of measurements than previous years, due to the disruption caused by the COVID-19 pandemic. This made these figures unsuitable for forming estimates at a local authority level, so that the latest statistics used for this analysis relate to the academic year 2019/20.
Please note that unless stated otherwise, where a simple calendar year is provided (such as “2040”) in this document and in the projections resulting from this analysis, that year is a representative shorthand of the academic year which ends within the relevant calendar year (for example, the academic year 2039/40).
Data collected
he data extracted from the NCMP data collection for this analysis included the following:
- Prevalence of both overweight and obesity among Reception children
- Prevalence of obesity among Reception children
- Prevalence of both overweight and obesity among Year 6 children
- Prevalence of obesity among Year 6 children.
The above statistics were extracted for all English single tier and county councils (that is, all English principal authorities excluding district councils), and for England as a whole. The local authorities of the City of London and the Isles of Scilly were not present in the data, due to having unusually small populations and often forming outliers compared to all other local authorities.
In some cases, local authorities or their boundaries changed during or after the seven-year period for which data was extracted. The measures taken to adjust for those changes was as follows:
Bournemouth, Christchurch and Poole Council: replaced Bournemouth and Poole unitaries and part of Dorset County Council on 1 April 2019, with the earliest available figures for the new council starting with 2019/20. The previous prevalence figures for Bournemouth Council have been used for academic years preceding this.
Dorset Council: replaced most of the area previously governed by Dorset County Council on 1 April 2019. As above, the earliest available figures for the new unitary authority start with 2019/20. For the years before this, figures for the previous Dorset County Council have been used.
Buckinghamshire Council: replaced Buckinghamshire County Council on 1 April 2020. All of the NCMP figures extracted relate to the former county council rather than the new unitary council, but as their boundaries are identical these estimates can be used to estimate future obesity prevalence for the unitary authority.
North Northamptonshire and West Northamptonshire Councils: replaced Northamptonshire County Council on 1 April 2021. All NCMP figures extracted relate to the former county council rather than the new unitaries. As such, it is not possible based on this analysis to arrive at individual projections for either of the two new councils, but only for Northamptonshire as a whole.
As a result, whilst there are 152 single-tier and county councils in existence in England, this forecasting approach produced estimates for 149 local authority areas (excluding the Isles of Scilly, City of London, North Northamptonshire and West Northamptonshire, and including one set of projections for the former Northamptonshire County Council).
The time range for which statistics were extracted covered the seven academic years starting from 2013/14 and ending with 2019/20. In a small number of cases 2013/14 figures were not available for some local authorities, and the projections in these cases rely only upon the subsequent six academic years.
In the statistics used, individual pupils were linked to local authorities based on the local authority that submitted their data. An alternative set of statistics was formerly published which aggregated pupils instead to the local authority of their residential postcode, but as of 2019/20 these figures are no longer published.
Projection methods
These historic child obesity figures have been projected forward using a regression-based approach where, for each authority, a line of best fit is calculated for its existing trend using “least squares” methodology. This best fit line was then projected forwards, to the following academic years:
- 2024/25 (henceforth “2025”)
- 2029/30 (henceforth “2030”)
- 2034/35 (henceforth “2035”)
- 2039/40 (henceforth “2040”).
The regression modelling was also used to calculate 95 per cent confidence intervals for each set of projections, giving an indication of their level of uncertainty and the range in which the actual levels of prevalence might be expected to fall.
By definition, this approach assumes that past trends are representative of future trends; as such, these forecasts estimate future child obesity prevalence under a scenario in which current factors influencing child obesity continue unmitigated.
This approach does not make use of individual pupil-level data or demographic projections; it simply takes a local authority area’s trajectory and extrapolates it into the future. As such, this approach is not as nuanced as other methodologies which may be based on more detailed information.
A further limitation of this approach is its assumption of a linear model; in certain cases where local authority areas have experienced unusually large increases or decreases in child obesity in previous years, this may result in their future forecasts containing implausibly high or low values. The limitations of these projections should be borne in mind when interpreting their findings, and due consideration should be given to the level and trajectory of historical figures and any insights offered by other available data sources.
Overall results
Table 1 and Figure 1 show the projected figures applying to England as a whole. Please note that Figure 1 combines the seven years of historic obesity prevalence data with a twenty-year period of projected data, meaning that the projected figures may appear to have a steeper slope than the historic figures.
These results show that child overweight and obesity at Reception might be expected to rise to almost 25 per cent by 2040, with the rate among Year 6 pupils expected to rise to over 40 per cent. Prevalence of obesity is projected to rise to almost 12 per cent of Reception pupils and almost 27 per cent of Year 6 Pupils.
Equivalent projections have also been derived for individual local authorities, demonstrating a wide range of variation by comparison to the overall England figures. Some local authorities are projected to have considerably higher prevalence of overweight and obesity by 2040 than England overall, whilst some are projected to see some level of decrease in overweight and obesity prevalence in the same time period.
Table 1: Projected child obesity prevalence across England, 2020-2040
|
|
2020 |
2025 |
2030 |
2035 |
2040 |
|---|---|---|---|---|---|
|
Reception - Overweight and Obese |
23.0% |
23.2% |
23.7% |
24.2% |
24.7% |
|
Reception - Obese |
9.9% |
10.2% |
10.7% |
11.1% |
11.6% |
|
Year 6 - Overweight and Obese |
35.2% |
36.2% |
37.5% |
38.9% |
40.2% |
|
Year 6 - Obese |
21.0% |
22.3% |
23.8% |
25.3% |
26.8% |
Figure 1. Historic and projected child obesity prevalence across England up to 2040
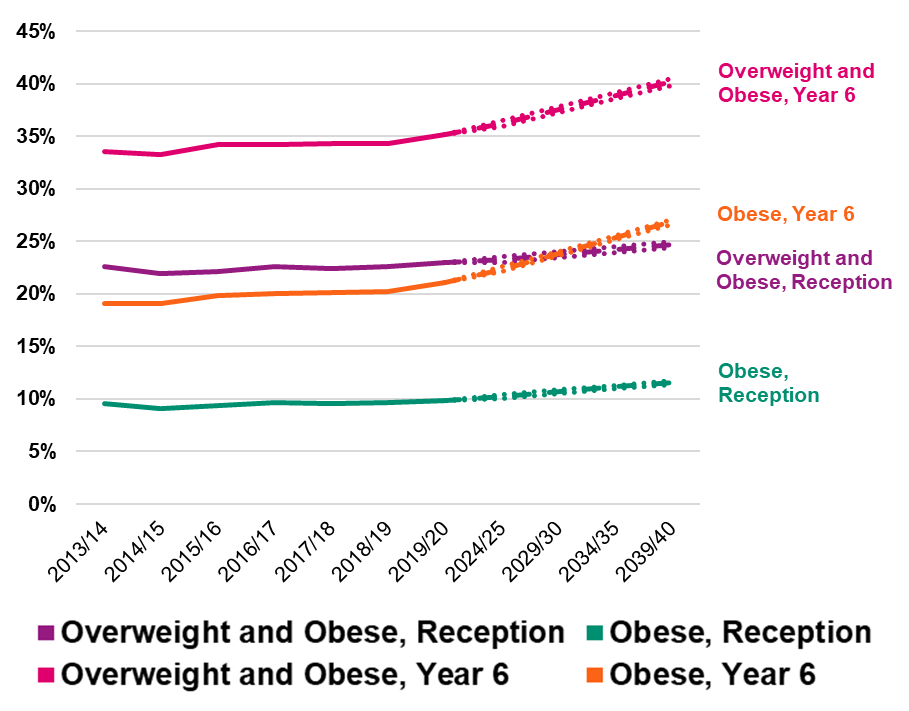
Line chart showing projected levels of obesity and overweight or obesity for England, for Reception and Year 6. This shows that by 2040, almost a quarter of Reception children are projected to be either overweight or obese, with almost 12 per cent projected to be obese. At Year 6, over 40 per cent of children are projected to be overweight or obese, with almost 27 per cent projected to be obese.
Comparison with level of deprivation
To examine whether the variation in projected child obesity between local authorities is related to local levels of deprivation, the local authority areas were grouped into quartiles according to their scores on the 2019 Index of Multiple Deprivation (IMD), and into a separate set of quartiles according to the corresponding Income Deprivation Affecting Children Index (IDACI). These quartiles, ranked from highest to lowest level of deprivation, were compared based on their average projected child obesity levels for both 2030 and 2040.
Figures 2 to 5 show the results of this comparison, demonstrating notable variation in average child obesity prevalence by deprivation, with more deprived authorities generally having higher rates of overweight and obesity. This relationship does not differ noticeably with timescale (2030 or 2040) or type of deprivation (IMD or IDACI).
Figure 2. Comparison of average projected overweight and obesity and level of deprivation (IMD, 2030)
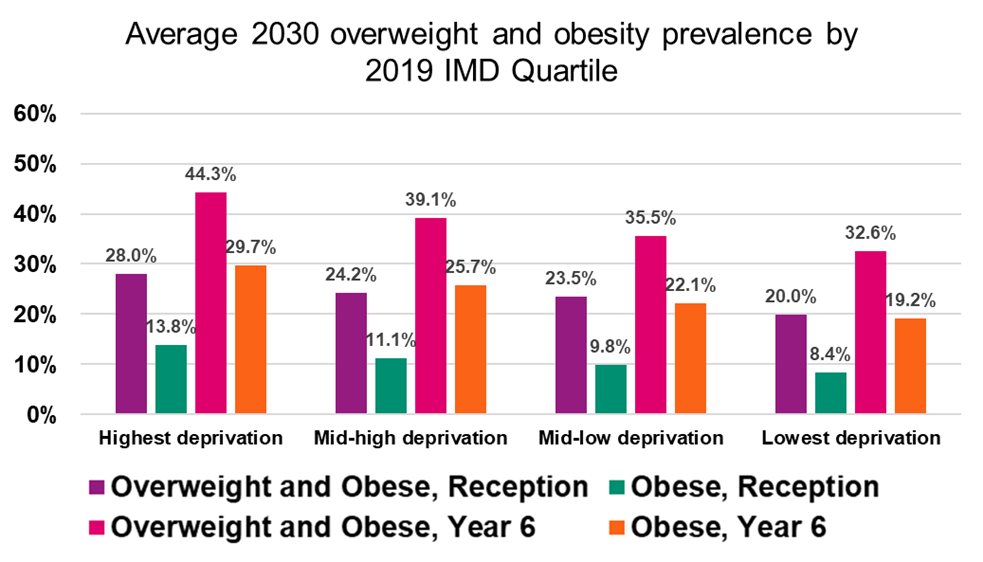
Column chart showing average 2030 levels of overweight or overweight and obesity prevalence by quartile of the Index of Multiple Deprivation (IMD). This shows that average prevalence of overweight and obesity are systematically higher among the more deprived quartiles of local authority areas than among less deprived quartiles. Average obesity among Reception children in 2030 is projected to be almost 14 per cent among the most deprived quartile, compared to just over eight per cent among the least deprived quartile. The comparison is 28 per cent versus 20 per cent for overweight and obese at Reception, almost 30 per cent versus almost 20 per cent for Year 6 obesity, and over 44 per cent versus almost 33 per cent for Year 6 overweight and obesity.
Figure 3. Comparison of average projected overweight and obesity and level of deprivation (IDACI, 2030)
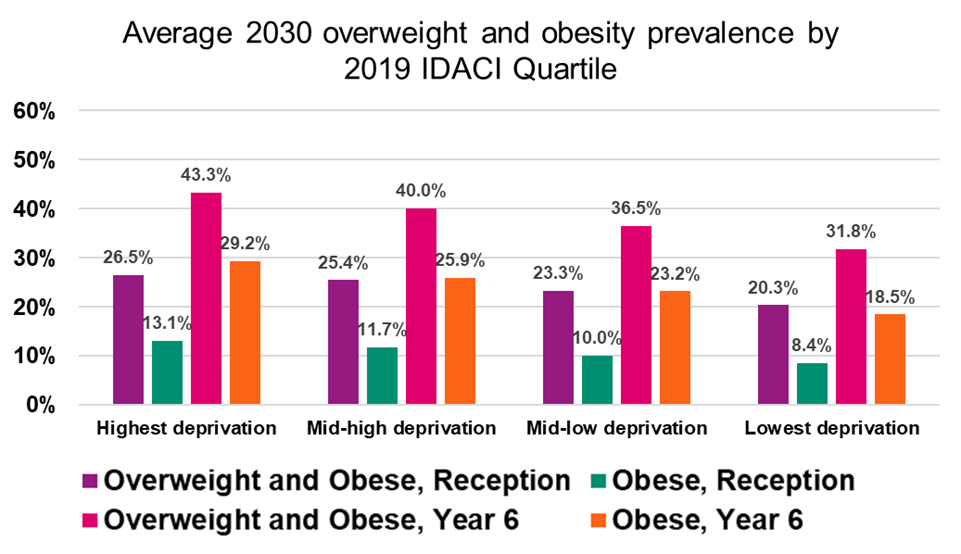
Column chart showing average 2030 levels of overweight or overweight and obesity prevalence by quartile of the Income Deprivation Affecting Children Index (IDACI). This shows that average prevalence of overweight and obesity are systematically higher among the more deprived quartiles of local authority areas than among less deprived quartiles. Average obesity among Reception children in 2030 is projected to be over 13 per cent among the most deprived quartile, compared to just over eight per cent among the least deprived quartile. The comparison is 27 per cent versus 20 per cent for overweight and obese at Reception, almost 30 per cent versus almost 19 per cent for Year 6 obesity, and almost 44 per cent versus almost 32 per cent for Year 6 overweight and obesity.
Figure 4. Comparison of average projected overweight and obesity and level of deprivation (IMD, 2040)
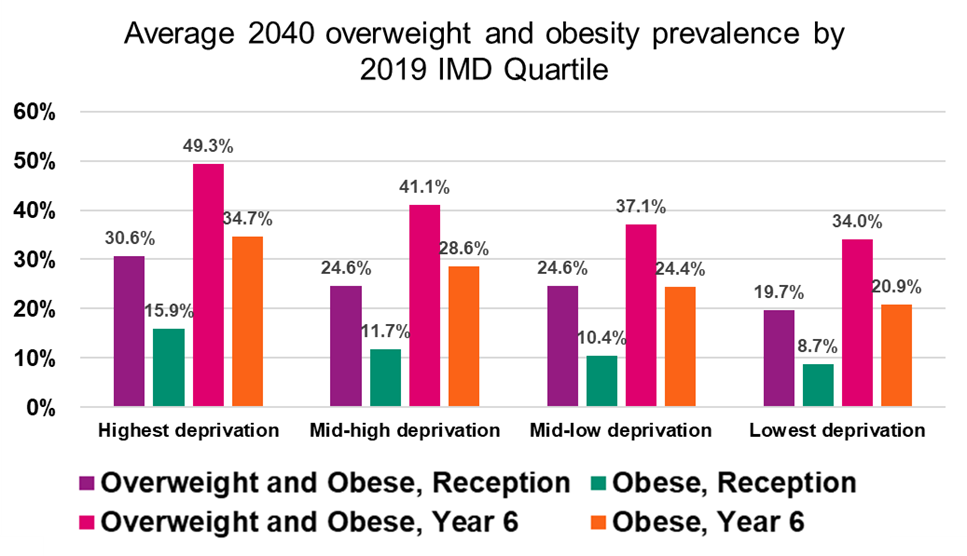
Column chart showing average 2040 levels of overweight or overweight and obesity prevalence by quartile of the Index of Multiple Deprivation (IMD). This shows that average prevalence of overweight and obesity are systematically higher among the more deprived quartiles of local authority areas than among less deprived quartiles. Average obesity among Reception children in 2040 is projected to be almost 16 per cent among the most deprived quartile, compared to just under nine per cent among the least deprived quartile. The comparison is over 30 per cent versus almost 20 per cent for overweight and obese at Reception, almost 35 per cent versus almost 21 per cent for Year 6 obesity, and almost 50 per cent versus over 34 per cent for Year 6 overweight and obesity.
Figure 5. Comparison of average projected overweight and obesity and level of deprivation (IDACI, 2040)
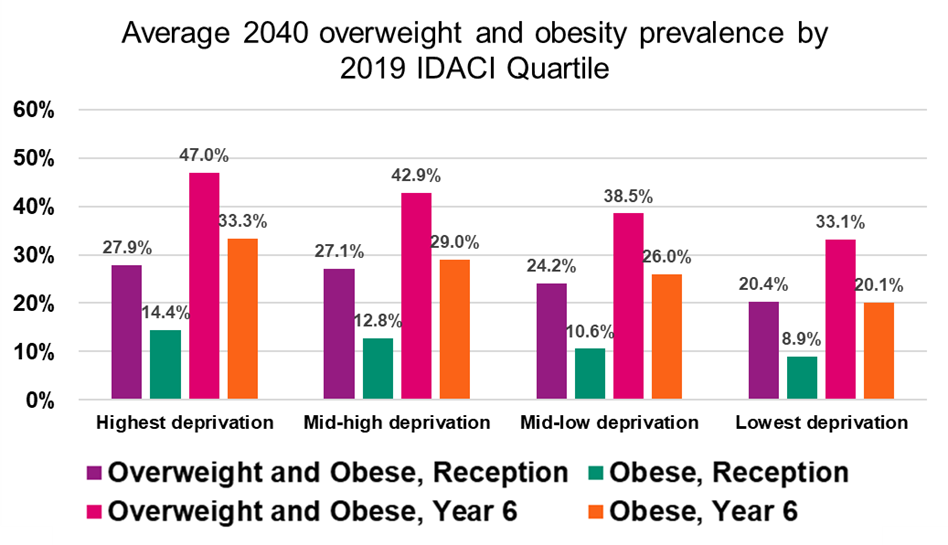
Column chart showing average 2040 levels of overweight or overweight and obesity prevalence by quartile of the Income Deprivation Affecting Children Index (IDACI). This shows that average prevalence of overweight and obesity are systematically higher among the more deprived quartiles of local authority areas than among less deprived quartiles. Average obesity among Reception children in 2040 is projected to be over 14 per cent among the most deprived quartile, compared to just under nine per cent among the least deprived quartile. The comparison is almost 28 per cent versus just over 20 per cent for overweight and obese at Reception, just over 33 per cent versus just over 20 per cent for Year 6 obesity, and 47 per cent versus just over 33 per cent for Year 6 overweight and obesity.