Resetting the relationship between local and national government. Read our Local Government White Paper
National Procurement Strategy: Delivering the Ambition – second diagnostic report

This report compiles data obtained from English and Welsh councils in 2021 in which they assessed their own performance against the LGA National Procurement Strategy 2018. It outlines examples of good practice and identifies key areas for improvement.
Key messages
- In 2021, councils in England and Wales continued to show solid progress implementing the ambition set out in the LGA National Procurement Strategy 2018, with most councils self-assessing as either ‘Developing’ or ‘Mature’ overall – the same as in 2018.
- The assessment looks at strategic policy areas such as commercialisation, community benefits, contract management and engaging with local businesses and the voluntary sector.
- Over 60 per cent of English councils took part in the self-assessment process.
- Achieving an assessment of ‘Mature’ continues to be seen as a very satisfactory outcome – we expected few councils to assess as ‘Leader’ or ‘Innovator’.
- Each council determined their own priorities and what mattered to them – there are no national targets.
- Identified areas of good practice will continue to be shared through case studies, webinars and conference sessions.
- Contract and relationship management and social value (community benefits achieved on the back of procurement exercises) were identified as the areas in most need of support in 2018. Implementing social value within the procurement process has improved since 2018. Working with VCSEs, SMEs and partners were highlighted as being in need of support in the 2021 exercise.
- Procurement has moved beyond ‘compliance’ since 2018, and there has been a strong programme of building capabilities since then that councils have been encouraged to access in order that they can better contribute to the delivery of strategic goals and policies.
- A continued investment in procurement skills and knowledge, particularly commercial skills, will help councils to deliver even greater financial and social benefits.
- The Government’s Green Paper ‘Transforming Public Procurement’ sets out the Cabinet Office proposals for shaping the future of public procurement legislation. The overarching goals of these proposals are to speed up and simplify procurement processes, place value for money at their heart, generate social value and unleash opportunities for small businesses, charities and social enterprises to innovate in public service delivery. The proposals set out are very much in line with the ambitions outlined in the LGA National Procurement Strategy 2018.
- The Government’s National Procurement Policy Statement sets out the Government’s strategic priorities for public procurement and how contracting authorities, including councils, can support their delivery. These priorities are:
- social value
- commercial and procurement delivery
- skills and capability for procurement.
Background
In July 2018, we published our revised National Procurement Strategy for Local Government in England – ‘Delivering the ambition’ – which superseded our original 2014 strategy. The 2018 strategy differed from its predecessor in several ways:
- It focused on three key themes which, consultation has shown, reflected local government’s priorities:
- showing leadership
- behaving commercially
- achieving community benefits.
- It took a broad view of the scope of procurement beyond compliance and tactical issues to include interrelated aspects of commercialisation, commissioning, contract management and the delivery of social value.
- It included a part two toolkit defining a maturity index for each of the 13 areas listed under the three themes. There are five levels in the maturity index:
- Level one – minimum
- Level two – developing
- Level three – mature
- Level four – leader
- Level five – innovator.
- Councils were invited to self-assess against the maturity index in 2018, the results of which can be found in the first diagnostic report, published in 2019.
In 2021, we repeated the England-wide self-assessment. Six councils in Wales also chose to undertake the self-assessment. This self-assessment is very important as it:
- allowed us to obtain a snapshot of where the sector is in relation to the National Procurement Strategy 2018
- allowed regions and clusters of councils to support each other for mutual gain and improvement
- helped individual councils gauge where they were in responding to the National Procurement Strategy 2018 and identify their own priorities for improvement
- helped to identify key areas where we can focus our support.
This report presents the results from the 2021 assessment.
About this research
In 2018, we used the diagnostic approach to allow councils to ‘self-assess’ their capabilities against the 55 'value codes' under each of the three themes set out in the National Procurement Strategy. The three themes are: leadership, behaving commercially and achieving community benefits.
A diagnostic differs from a traditional survey in the following ways:
- It is a statement of fact based against predefined outcomes rather than a subjective opinion (that is, one council’s ‘Very good’ could be another council’s ‘Average’).
- It uses a controlled list of invited participants, one per council, and is based on focused topics which can be adapted to environmental changes and business improvement.
- It seeks to identify root causes for issues/ problems while allowing participating organisations to define what actions and resources are needed to drive their own improvement.
We had already designed our National Procurement Strategy 2018 as a dynamic document with a view to its aspirations being measured and reported on. The exercise in 2021 was the same as the exercise in 2018 to allow councils to be able to compare progress since then against each of the value codes.
In 2021, responding councils were again asked for their top three priority areas for support and the nature of the support required.
The facility for councils to include supporting information and local examples in support of their self-assessments remained and was used by 56 per cent of respondents (up from 38 per cent last time). On completion of the diagnostic, councils were able to download a copy of their own responses. Later, they could download their data again with comparative regional and national ‘benchmarks’ based on all responses received.
The diagnostic was completed by 132 county / unitary / metropolitan councils (including six from Wales) and 80 district councils.
35 per cent of councils responded in both 2018 and 2021. 25 per cent of respondents in 2021 had not responded in 2018 and 57 of the 2018 councils did not respond in 2021 (some have merged, some no longer exist due to local government reorganisation in the interim period).
Findings
In the graphs below, the following colours indicate the following self-assessment levels:

Minimum
– red indicates a self-assessment level of 'Minimum' (the lowest level)

Developing
– orange indicates a self-assessment level of 'Developing'

Mature
– yellow indicates a self-assessment level of 'Mature'

Leader
– light green indicates a self-assessment level of 'Leader'

Innovator
– dark green indicates a self-assessment level of 'Innovator' (the highest level)
Understanding the assessment
In reporting the findings it is important to put the range of defined outcomes into context – from ‘Minimum’ to ‘Innovator’.
When launching our National Procurement Strategy in 2018, we made it clear that it was not attaching any priorities, targets or scale of importance to any of the 55 value codes. It recognised that there were differences between upper tier and district councils and that even neighbouring councils in the same tier could have widely differing priorities. It was for each council taking part in the assessment to define what matters and decide the level of attainment to which it wanted to aspire. It is important to note that:
- level three ('Mature') assessments are a creditable outcome and, in most cases, might not warrant further improvement in the short- to medium-term
- level four or five assessments would only be made when an individual council had evolved to a point that it could act as an exemplar to other councils in a given area and be able to help others raise standards where they considered it to be important
- level two or even level one assessments could also be acceptable, particularly if the assessing council did not deem a given value code to hold local importance
- other factors that need to be considered when reporting the findings are that:
- a gap between upper tier and district councils was to be expected given the differing priorities, operational scale and resourcing levels
- regional variations were also to be expected reflecting socio-economic, political and geographical considerations
- individual assessments made for each value code were likely to be averages and did not reflect the potentially wide variations of outcome that are usually found within individual councils – variations of up to four levels are not uncommon
- average findings can be influenced by the number of councils responding and the size of the target group (for example the number of councils in a region)
- moving up one assessment level can take a significant amount of resource and/or time depending on the content of the agreed local action plan.
Typically, good practice is defined as an assessment at level four or five, with three being a perfectly acceptable level of attainment. In reality, very few would be expected to assess at level five ('Innovator') as, by definition, this makes them sector pioneers for new thinking, techniques and approaches. Assessments at level four ('Leader) are more likely to be achieved and can be counted as ‘good practice’ which should be promoted across the sector.
2021 assessment outcomes
County, unitary and metropolitan councils
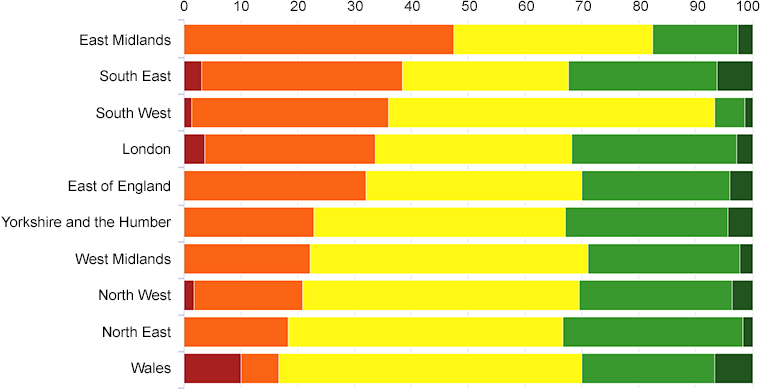
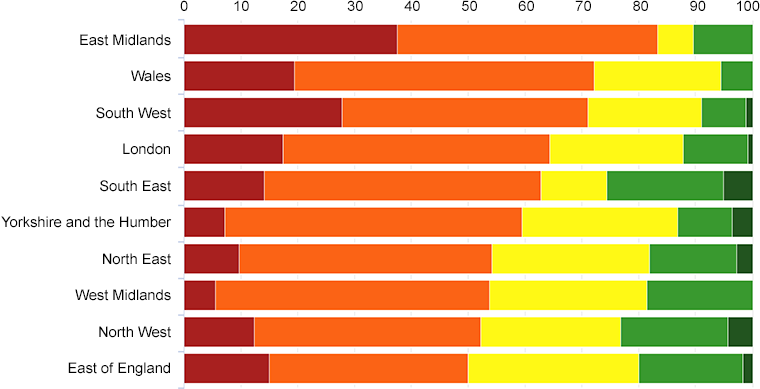
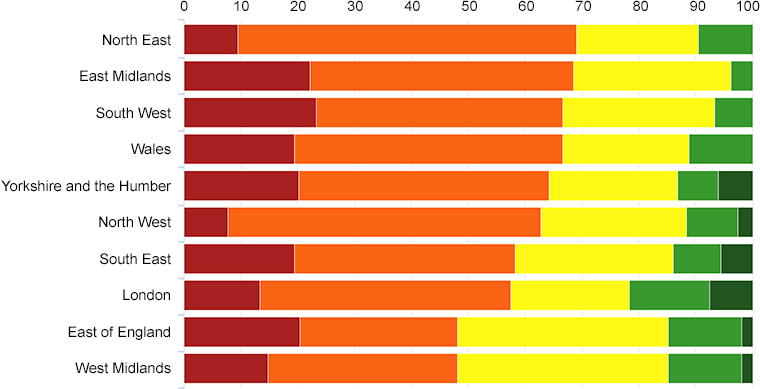
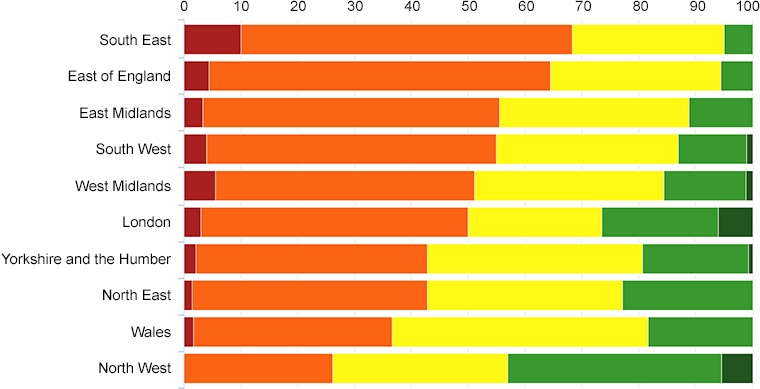
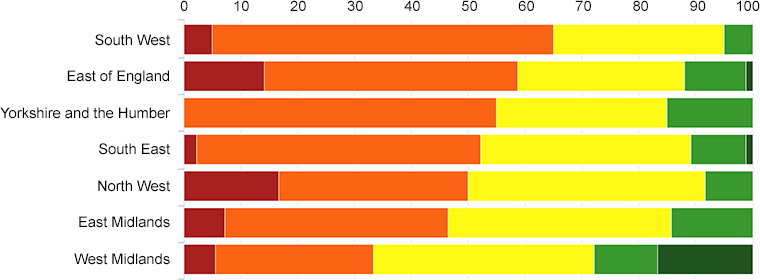
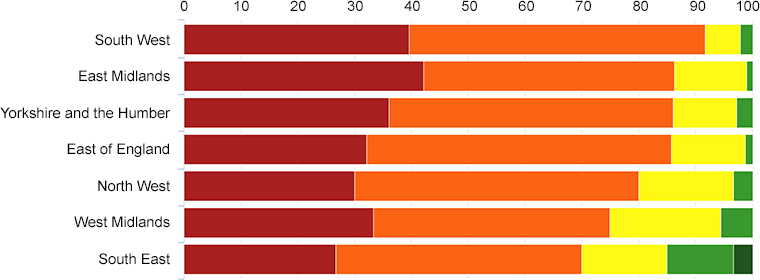
In 2018 there was a close correlation between the highest and lowest assessments for the ten sections with ‘Engaging senior managers’ achieving the highest scores and ‘Contract and relationship management’ achieving the lowest. In 2021, ‘Managing strategic risk’ had risen to be the highest scoring section with ‘Contract and relationship management’ remaining the lowest scoring section. Table 1 shows the average score distribution by region for managing strategic risk. Tables 2a and 2b compare the average score distribution by region for contract and relationship management in 2018 with the 2021 responses.
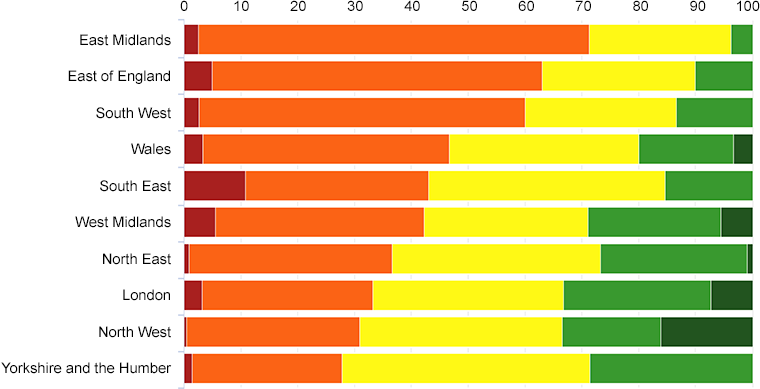
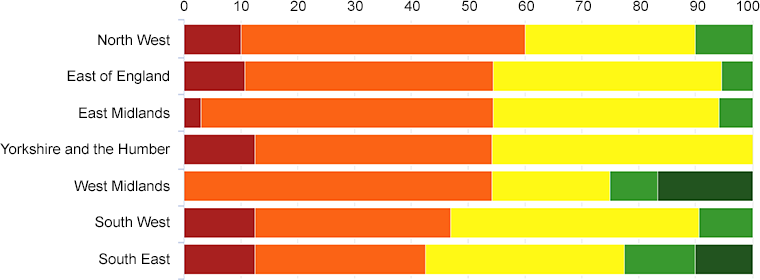
In 2018, ‘Achieving social value’ had featured as an area of concern. In 2021, this had changed with many more councils identifying as 'Mature', 'Leader' or 'Innovator' – reflecting the importance that social value has gained for councils in the interim period.
Tables 3a and 3b show the changes in response in relation to ‘Achieving social value’ over the two diagnostic exercises.
| Region | Minimum | Developing | Mature | Leader | Innovator |
|---|---|---|---|---|---|
| Wales | 10.0 | 6.7 | 53.3 | 23.3 | 6.7 |
| North East | 0.0 | 18.3 | 48.3 | 31.7 | 1.7 |
| North West | 1.7 | 19.1 | 48.7 | 27.0 | 3.5 |
| West Midlands | 0.0 | 22.2 | 48.9 | 26.7 | 2.2 |
| Yorkshire and Humber | 0.0 | 22.9 | 44.3 | 28.6 | 4.2 |
| East of England | 0.0 | 32.0 | 38.0 | 26.0 | 4.0 |
| London | 3.6 | 30.0 | 34.5 | 29.1 | 2.8 |
| South West | 1.3 | 34.7 | 57.3 | 5.3 | 1.4 |
| South East | 3.1 | 35.4 | 29.2 | 26.2 | 6.1 |
| East Midlands | 0.0 | 47.5 | 35.0 | 15.0 | 2.5 |
| Region | Minimum | Developing | Mature | Leader | Innovator |
|---|---|---|---|---|---|
| East of England | 15.0 | 35.0 | 30.0 | 18.3 | 1.7 |
| North West | 12.3 | 39.9 | 24.6 | 18.8 | 4.4 |
| West Midlands | 5.6 | 48.1 | 27.8 | 18.5 | 0.0 |
| North East | 9.7 | 44.4 | 27.8 | 15.3 | 2.8 |
| Yorkshire and Humber | 7.1 | 52.4 | 27.4 | 9.5 | 3.6 |
| South East | 14.1 | 48.7 | 11.5 | 20.5 | 5.2 |
| London | 17.4 | 47.0 | 23.5 | 11.4 | 0.7 |
| South West | 27.8 | 43.3 | 20.0 | 7.8 | 1.1 |
| Wales | 19.4 | 52.8 | 22.2 | 5.6 | 0.0 |
| East Midlands | 37.5 | 45.8 | 6.3 | 10.4 | 0.0 |
| Region | Minimum | Developing | Mature | Leader | Innovator |
|---|---|---|---|---|---|
| West Midlands | 14.8 | 33.3 | 37.0 | 13.0 | 1.9 |
| East of England | 20.4 | 27.8 | 37.0 | 13.0 | 1.8 |
| London | 13.3 | 44.2 | 20.8 | 14.2 | 7.5 |
| South East | 19.4 | 38.9 | 27.8 | 8.3 | 5.6 |
| North West | 7.7 | 55.1 | 25.6 | 9.0 | 2.6 |
| Yorkshire and Humber | 20.2 | 44.0 | 22.6 | 7.2 | 6.0 |
| Wales | 19.4 | 47.2 | 22.2 | 11.2 | 0.0 |
| South West | 23.3 | 43.3 | 26.7 | 6.7 | 0.0 |
| East Midlands | 22.2 | 46.3 | 27.8 | 3.7 | 0.0 |
| North East | 9.5 | 59.5 | 21.5 | 9.5 | 0.0 |
| Region | Minimum | Developing | Mature | Leader | Innovator |
|---|---|---|---|---|---|
| Yorkshire and Humber | 1.4 | 26.4 | 43.6 | 28.6 | 0.0 |
| North West | 0.4 | 30.4 | 35.7 | 17.4 | 16.1 |
| London | 3.2 | 30.0 | 33.6 | 25.9 | 7.3 |
| North East | 0.8 | 35.8 | 36.7 | 25.8 | 0.9 |
| West Midlands | 5.6 | 36.7 | 28.8 | 23.3 | 5.6 |
| South East | 10.8 | 32.3 | 41.5 | 15.4 | 0.0 |
| Wales | 3.3 | 43.3 | 33.4 | 16.7 | 3.3 |
| South West | 2.7 | 57.3 | 26.7 | 13.3 | 0.0 |
| East of England | 5.0 | 58.0 | 27.0 | 10.0 | 0.0 |
| East Midlands | 2.5 | 68.7 | 25.0 | 3.8 | 0.0 |
| Region | Minimum | Developing | Mature | Leader | Innovator |
|---|---|---|---|---|---|
| North West | 0.0 | 26.2 | 30.7 | 37.7 | 5.4 |
| Wales | 1.7 | 35.0 | 45.0 | 18.3 | 0.0 |
| North East | 1.4 | 41.4 | 34.3 | 22.9 | 0.0 |
| Yorkshire and Humber | 2.1 | 40.7 | 37.9 | 18.6 | 0.7 |
| London | 3.0 | 47.0 | 23.5 | 20.5 | 6.0 |
| West Midlands | 5.6 | 45.6 | 33.3 | 14.4 | 1.1 |
| South West | 4.0 | 51.0 | 32.0 | 12.0 | 1.0 |
| East Midlands | 3.3 | 52.2 | 33.3 | 11.2 | 0.0 |
| East of England | 4.4 | 60.0 | 30.0 | 5.6 | 0.0 |
| South East | 10.0 | 58.3 | 26.7 | 5.0 | 0.0 |
Sample comments
'Contract and relationship management' self-assessed at level two:
“The council is at a development stage, progressing to maturity. A contract register is visible to the organisation and the public. Regular validation is carried out to ensure accuracy of the register. Data quality on low value purchases needs to improve and plans are in place to develop proposals for a centralised buying team for low value.”
'Managing strategic risk' self-assessed at level five:
“The council actively manages external risk events both corporately and at strategic / operational contract management level. A corporate risk register and monitoring process is set up to report and manage individually identified events, for example, Brexit.”
'Obtaining social value' self-assessed at level four:
“Social value is included in all centrally procured contracts. Work is currently taking place to include grants as standard. Work is ongoing around living wage and ethical procurement. The council aims to be an 'Innovator' within 18 months.”
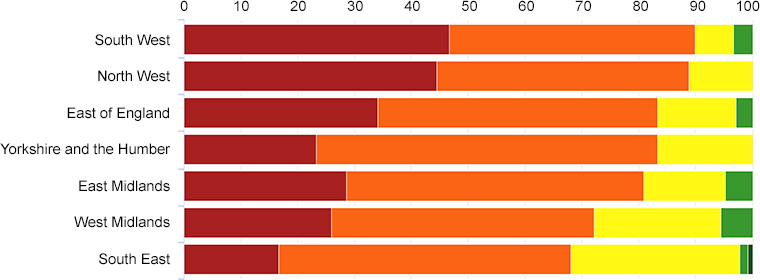
District councils
As with upper tier councils, there is a close correlation between the highest and lowest assessments for the 10 sections with ‘engaging senior managers’ achieving the highest and ‘contract and relationship management’ achieving the lowest. This duplicates the high and low scores for 2018.
Tables 4a, 4b, 5a and 5b set out the scores for each, by region.
| Region | Minimum | Developing | Mature | Leader | Innovator |
|---|---|---|---|---|---|
| West Midlands | 5.6 | 27.8 | 38.8 | 11.1 | 16.7 |
| East Midlands | 7.1 | 39.3 | 39.3 | 14.3 | 0.0 |
| North West | 16.7 | 33.3 | 41.7 | 8.3 | 0.0 |
| South East | 2.2 | 50.0 | 37.0 | 9.7 | 1.1 |
| Yorkshire and Humber | 0.0 | 55.0 | 30.0 | 15.0 | 0.0 |
| East of England | 14.1 | 44.6 | 29.3 | 10.9 | 1.1 |
| South West | 5.0 | 60.0 | 30.0 | 5.0 | 0.0 |
| Region | Minimum | Developing | Mature | Leader | Innovator |
|---|---|---|---|---|---|
| South East | 12.5 | 30.0 | 35.0 | 12.5 | 10.0 |
| South West | 12.5 | 34.4 | 43.7 | 9.4 | 0.0 |
| West Midlands | 0.0 | 54.2 | 20.8 | 8.3 | 16.7 |
| Yorkshire and Humber | 12.5 | 41.7 | 45.8 | 0.0 | 0.0 |
| East Midlands | 2.9 | 51.5 | 39.7 | 5.9 | 0.0 |
| East of England | 10.7 | 43.7 | 40.2 | 5.4 | 0.0 |
| North West | 10.0 | 50.0 | 30.0 | 10.0 | 0.0 |
| Region | Minimum | Developing | Mature | Leader | Innovator |
|---|---|---|---|---|---|
| South East | 16.7 | 51.4 | 29.7 | 1.4 | 0.8 |
| West Midlands | 25.9 | 46.3 | 22.2 | 5.6 | 0.0 |
| East Midlands | 28.5 | 52.4 | 14.3 | 4.8 | 0.0 |
| Yorkshire and Humber | 23.3 | 60.0 | 16.7 | 0.0 | 0.0 |
| East of England | 34.1 | 49.3 | 13.7 | 2.9 | 0.0 |
| North West | 44.4 | 44.4 | 11.2 | 0.0 | 0.0 |
| South West | 46.7 | 43.3 | 6.7 | 3.3 | 0.0 |
| Region | Minimum | Developing | Mature | Leader | Innovator |
|---|---|---|---|---|---|
| South East | 26.7 | 43.3 | 15.0 | 11.7 | 3.3 |
| West Midlands | 33.3 | 41.7 | 19.4 | 5.6 | 0.0 |
| North West | 30.0 | 50.0 | 16.7 | 3.3 | 0.0 |
| East of England | 32.1 | 53.6 | 13.1 | 1.2 | 0.0 |
| Yorkshire and Humber | 36.1 | 50.0 | 11.1 | 2.8 | 0.0 |
| East Midlands | 42.2 | 44.1 | 12.7 | 1.0 | 0.0 |
| South West | 39.5 | 52.1 | 6.3 | 2.1 | 0.0 |
Sample comments
'Contract and relationship management' self-assessed at level two:
“This has been the focus of operational improvement in 2020/21”
'Contract and relationship management' self-assessed at level three:
"The contract register is more readily accessible and purpose-built to meet our council's needs. It's viewable by all council employees (with editing rights only being available to service area managers and contract owners) and all data fields are near complete. A new version of the register is being explored that will be integrated with the council's finance system to facilitate the inclusion of accurate financial data and to ensure it is fully up to date.”
'Engaging senior managers' self-assessed at level three:
“We have set up a procurement board (made up of the procurement team, the senior management team, and the corporate management sponsor) to scrutinise project issues, facilitate delays in procurements, inform the future plan, prioritise strategic initiatives and set strategic objectives. It is also a means to ensure accountability for procurement within each service area...and to help co-ordinate procurement activities across the organisation.”
Overall results
An analysis of the overall results shows:
- There is on average a variation of 0.6 between assessment made by upper tier councils compared with their colleagues in district councils – understandable given that they have more resources at their disposal. This is calculated as the difference between the highest and lowest overall average scores for both tiers. It compares with an average variation of 0.5 in 2018.
- The assessment ranking between both levels is fairly consistent, with the highest and lowest assessments overlapping.
- The regional range is potentially not statistically significant as the minimum/maximum values are often influenced by a smaller respondent sample size.
- Again, there are clear regional variations at value code level, but not at section level.
- The usual good practice/room for improvement analysis cannot readily be applied given the close correlation between the highest and lowest assessments.
- Greater importance still needs to be attached to those councils assessing at lower levels, particularly where there may be a desire for improvement.
Developing this latter point, tables 6 and 7 below show the number of responses at each of the five assessment levels for the top and bottom five value codes sections by tier.
| Section | Average | Low | High |
|---|---|---|---|
| Contract and relationship management | 2.39 | 1.90 | 2.63 |
| Engaging strategic suppliers | 2.45 | 2.17 | 2.71 |
| Creating commercial opportunities | 2.51 | 2.06 | 2.82 |
| Engaging councillors | 2.58 | 2.06 | 2.87 |
| Local SME and micro-business engagement | 2.64 | 2.23 | 3.02 |
| Obtaining social value | 2.76 | 2.30 | 3.18 |
| Working with partners | 2.78 | 2.27 | 3.30 |
| Enablers | 2.78 | 2.41 | 3.17 |
| Engaging VCSEs (voluntary, community and social enterprises) | 2.83 | 2.15 | 3.04 |
| Engaging senior managers | 2.88 | 2.63 | 3.15 |
| Managing strategic risk | 3.00 | 2.71 | 3.17 |
| Section | Average | Low | High |
|---|---|---|---|
| Contract and relationship management | 1.90 | 1.67 | 2.18 |
| Engaging strategic suppliers | 1.94 | 1.56 | 2.30 |
| Creating commercial opportunities | 1.96 | 1.63 | 2.22 |
| Engaging VCSEs (voluntary, community and social enterprises) | 2.15 | 1.88 | 2.44 |
| Engaging councillors | 2.16 | 1.80 | 2.63 |
| Obtaining social value | 2.17 | 1.88 | 2.32 |
| Local SME and micro-business engagement | 2.23 | 1.95 | 2.41 |
| Enablers | 2.38 | 2.08 | 2.81 |
| Working with partners | 2.38 | 1.89 | 3.11 |
| Managing strategic risk | 2.56 | 2.27 | 2.84 |
| Engaging senior managers | 2.57 | 2.35 | 3.06 |
Comparing highest and lowest scores with 2018 results
The assessments against the following value codes have significantly risen since 2018 meaning councils have significantly improved in their ability to manage in these areas:
| Section | Value code | |
|---|---|---|
| Managing strategic risk | External events (for example, Brexit) | 29 |
| Obtaining social value | Procurement (social value) | 20 |
| C&RM | Supplier financial distress | 15 |
| Managing strategic risk | Fraud and financial loss | 13 |
| Obtaining social value | Social value TOMs (themes, outcomes and measures) | 13 |
| Obtaining social value | Social value governance | 10 |
| Managing strategic risk | Modern slavery (legislation) | 10 |
| Section | Value code | |
|---|---|---|
| Managing strategic risk | External events (for example, Brexit) | 18 |
| Engaging councillors | Reporting | 12 |
| Obtaining social value | Social value contract management | 10 |
The assessments against the following value codes have reduced since 2018, meaning councils have declined in their ability to manage in these areas.
| Section | Value code | |
|---|---|---|
| Engaging VCSEs | Procurement with VCSEs | -10 |
| Engaging VCSEs | Policy and scope (VCSEs) | -10 |
| Working with partners | Governance and processes | -10 |
| Working with partners | Staff development for partnership working | -10 |
| Engaging VCSEs | Contract management with VCSEs | -10 |
| Local SME and micro-business engagement | Policy and scope (SMEs) | -14 |
| Local SME and micro-business engagement | Market engagement with SMEs | -15 |
| Section | Value code | |
|---|---|---|
| Local SME and micro-business engagement | Commissioning with SMEs | -10 |
| Local SME and micro-business engagement | Procurement with SMEs | -13 |
| Creating commercial opportunities | Market / supplier research / analysis | -13 |
| C&RM | Recognition / cultural acceptance | -15 |
Identifying good practice
Tables 8 and 9 show the overall distribution of each of the five assessments across each of the 10 sections that make up the three themes.
| Section | 1 | 2 | 3 | 4 | 5 |
|---|---|---|---|---|---|
| Contract and relationship management | 17 | 46 | 22 | 13 | 3 |
| Engaging councillors | 16 | 27 | 39 | 15 | 3 |
| Creating commercial opportunities | 12 | 46 | 25 | 14 | 4 |
| Engaging strategic suppliers | 10 | 41 | 36 | 10 | 3 |
| Working with partners | 9 | 28 | 41 | 18 | 6 |
| Local SMEs and micro businesses | 4 | 45 | 38 | 11 | 3 |
| Managing strategic risk | 4 | 33 | 43 | 16 | 3 |
| Engaging senior management | 7 | 30 | 34 | 21 | 7 |
| Obtaining social value | 3 | 41 | 33 | 18 | 6 |
| Engaging VCSEs | 5 | 29 | 46 | 15 | 4 |
| Section | 1 | 2 | 3 | 4 | 5 |
|---|---|---|---|---|---|
| Contract and relationship management | 31 | 49 | 16 | 3 | 1 |
| Obtaining social value | 12 | 63 | 20 | 4 | 1 |
| Creating commercial opportunities | 22 | 61 | 12 | 5 | 0 |
| Engaging VCSEs | 19 | 52 | 27 | 3 | 0 |
| Engaging councillors | 24 | 36 | 34 | 7 | 0 |
| Engaging strategic suppliers | 26 | 53 | 18 | 4 | 0 |
| Local SMEs and micro businesses | 13 | 54 | 28 | 4 | 2 |
| Working with partners | 16 | 39 | 29 | 10 | 7 |
| Engaging senior management | 8 | 43 | 35 | 10 | 6 |
| Managing strategic risk | 4 | 49 | 36 | 12 | 1 |
The redefinition of the five assessment levels in 2018 had significantly reduced the number of councils assessing as four or five from the previous assessment against the 2014 procurement strategy.
It is encouraging that councils have made the effort to outline evidence to justify high (or low) scores. This evidence has been used to identify where the good practice lies within each of the value codes and will allow the LGA to encourage sharing of that good practice. Conversely it has allowed us to identify councils who have scored at the lower end of the scale in order that we can prioritise them for support as this becomes available.
This, together with accompanying supporting comments, suggests that there will continue to be opportunities to:
- develop good practice guides, particularly for those sections / value codes where there is a clear demand
- develop regional and cluster groupings to help provide a qualified improvement network
- capture and disseminate appropriate knowledge and learning.
Key enablers
A further set of questions were grouped together under the header ‘enablers’. These are cross cutting issues that also need to be addressed if councils are to realise their ambitions in the key areas. The four enablers are:
- developing talent
- exploiting digital technology
- enabling innovation
- embedding change.
Developing talent
An important part of the National Procurement Policy Statement, ‘Skills and Capability for Procurement’ requires councils to “consider their organisational capability and capacity, with regard to the procurement skills and resources required to deliver value for money”. While councils’ self-assessment scores were on average 2.94 for county, unitary and metropolitan councils and 2.43 for district councils a number of comments were made in relation to recruitment difficulties. Councils saw the value in developing in-house talent through a mixture of professional training (mostly through the Chartered Institute of Procurement and Supply) and ad-hoc training and the potential to recruit through apprenticeships featured in the comments.
Exploiting digital technology
Average scores for county, unitary and metropolitan councils were 2.63 with district councils scoring on average 2.29. All councils have access to basic purchase order functionality and most councils have access at least to an integrated procure to pay system but there were several comments about systems needing updating and further integration, particularly around contract management systems. Government set out an ambition out in Transforming Public Procurement to implement a central digital platform for commercial data. The platform itself will be centrally funded, and it is Government’s intention that the services would be free for all users. This will bring benefits to councils who will be able to access information about suppliers along with additional challenges in relation to integration.
Enabling innovation
This section focussed on the extent to which councils were able to capture and harness procurement innovation within the organisation. County, unitary and metropolitan councils self-assessed at 2.64 and district councils at 2.43. Comments generally were about innovation being considered for some ‘technology’ projects but not routinely considered for all projects.
Embedding change
County, unitary and metropolitan councils self-assessed at 2.91 on average with district councils self-assessing at 2.37. A lot of comments were received on this section with most of them positive relating to new approaches being implemented only in some parts of the council.
Next steps
The National Advisory Group, which reports to our Improvement and Innovation Board, will continue to look at ways in which it can help channel resources as a means of helping councils to seek improvement in the areas that matter to them. Many of the regional heads of procurement groups also seek to do likewise based on localised priorities. We will also:
- make this report available to all councils (chief executives, leaders and heads of procurement) and professional networks
- develop new proposals for targeting resources aimed at improvement – particularly for contract management and working with partners
- produce case studies and encourage councils to present them through our various conferences, webinars and roundtables
- encourage regions to develop local action plans
- help identify contacts in those councils which did not engage in the 2021 diagnostic exercise.