Resetting the relationship between local and national government. Read our Local Government White Paper
Fragmented Funding - report

Research into the nature of central government funding for local government, 2015/16-2017/18.
Introduction
Councils are at the heart of their local areas. As place leaders and with a democratic mandate, they are the only agency which can bring together local people and ensure that everyone has access to the public services which communities need to thrive. They make sure families have access to good local schools; they build high-quality, affordable homes; they keep streets clean, and play a unique leadership role in promoting social mobility, fairness, and community cohesion.
Even prior to the COVID-19 pandemic, councils had seen dramatic reductions in core funding from government over the last decade and were facing a funding gap of £6.5 billion by 2024/25. [1]
Now – dealing with the significant financial impact caused by extra costs, loss of income, and cash flow pressures – councils will need at least £2 billion more to meet the full financial impact of the pandemic in 2020/21. This is placing serious and ongoing pressures on local services.
Despite this, councils’ determination to support their communities has ensured that the delivery of hundreds of vital services continues. They have streamlined services, joined with other councils, and found new and innovative ways of operating while still delivering the services their residents rely on.
Recent Local Government Association (LGA) research shows that, on average, councils have saved £356 per household between 2016/17 and 2019/20 – which, if grossed up, is an estimated total savings figure of £10.98 billion across all English councils – through generating additional income, transforming their services, and renegotiating their contracts. [2]
Councils have innovated, reimagined and changed the ways they work to deliver significant savings and efficiencies. But there is only so much that they can do in the face of large reductions in government funding and increasing demand for their services.
At the same time, the funding landscape is becoming more complex. In face of reductions in core funding, councils are seeing a proliferation in the number of small grants. Unlike core funding programmes, these grants are often very specific, very short-term, and competitively accessed, limiting what councils can deliver. They are also replacing flexible funding, oriented towards prevention, with reactive grants designed to manage rising levels of demand.
To deliver joined-up, efficient, and effective public services, councils need the flexibility to put the needs of residents firmly at their core, without the added burden of navigating a complex and fragmented funding landscape. This is the best way to get value from scarce public resources, and to provide services which prevent crisis, rather than simply managing it.
With the upcoming Spending Review, we have an opportunity to think differently about how we fund our public services – to serve our residents, empower communities, and ensure that local plans deliver for local people.
[1] LGA funding gap analysis
[2] Local Government Association (2020) ‘Spending Review survey: A survey of councils’
About this research
This research, commissioned by the LGA and delivered by TRL Insight, looks at how the local government funding landscape has developed in recent years, with a focus on the characteristics of grants coming from central government.
It builds on previous LGA research on fragmentation in local government funding. In 2012, we examined the provision of funding for services for young people; this research revealed a highly complex system, where councils had limited direct control over local services.
In 2014, we looked at fragmentation in government funding for economic development and regeneration, updating this research in 2016 to show that delivering long-term and coherent growth and infrastructure projects suffers when councils have to manage multiple, disparate funding sources.
The National Audit Office has also examined this topic, and, in their 2018 report on the financial sustainability of local authorities, found that the current Spending Review period was ‘characterised by one-off and short-term funding fixes’, and a ‘crisis-driven approach to managing local authority finances’.
This research builds on the above by mapping for the first time all grants, across all service areas, issued by central government to councils, combined authorities, and fire and rescue authorities in England over the period 2015/16 to 2018/19.
We used a wide range of publicly available governmental data, including HM Treasury databases and registers, published funding allocations, and local authority financial returns, and we have supplemented this with data shared directly by government departments.
This has produced a database of 448 grants. We analysed these to understand which department issued them, which services they are intended to support, how they are allocated, and how long they are intended to last.
We also spoke to twelve senior council officers working in four of the service areas experiencing the greatest funding challenges: adult social care, homelessness, children and families, and public health. They were able to illustrate for us how an increasingly fragmented funding landscape has impacted on the way councils and their partners manage and deliver services.
Key findings
Local government has received hundreds of grants in recent years
English local government received at least 448 unique grants from central government between 2015/16 to 2018/19. In any given year, they receive roughly 250 grants.
Councils receive more grants now than in the past
Direct comparisons are difficult due to the comprehensive nature of this research. However, previous research carried out by the National Audit Office in 2014 suggests that approximately 61 main grants were paid to local authorities in 2013/14.
The total amount of grant funding going to local government is decreasing
Councils’ grant funding from central government has fallen from £83.1 billion in 2015/16 to £69.9 billion in 2018/19 – a decrease of 15.8 per cent over four years. This includes steep decreases in both revenue and capital funding.
Based on budget figures published by the Ministry of Housing, Communities and Local Government (MHCLG) in 2019/20, funding for councils will continue to fall.
The most significant grants to councils are decreasing
Most of the funding for councils comes through a few large grants, including housing benefit funding, the revenue support grant, and the public health grant.
However, the size of these grants has decreased over time.
Figure 1: Change in funding between 2015/16 and 2018/19 – cash terms
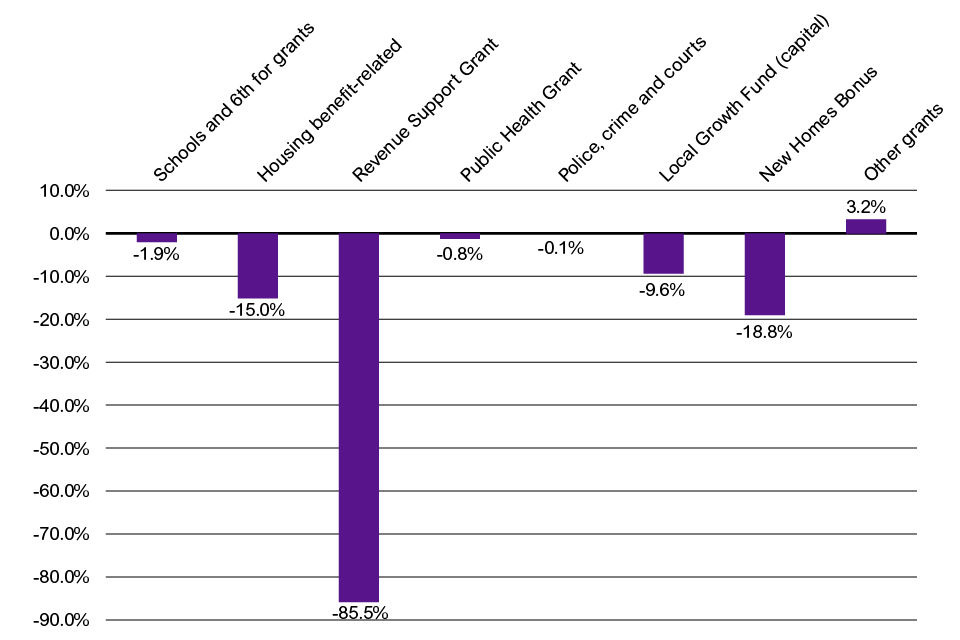
The reduction in Revenue Support Grant shown in Figure 1 has come alongside the introduction of 50 per cent business rates retention from 2013/14, meaning that some resources which might have been paid as grant are paid from business rates retained by local government as a whole. However, the Settlement Funding Assessment, which includes assumed business rates collected locally as well as Revenue Support Grant, has fallen by 26.7 per cent in the same period. [3]
Revenue Support Grant was due to have been phased out entirely with the introduction of further business rates retention, but this has now been postponed and will not happen in 2021. Further business rates retention would change the make-up of council funding, increasing potential rewards but also risks, such as losses in income due to business rates appeals.
Local authorities have little discretion over the bulk of their grant funding
In the two biggest funding categories shown in figure two – schools and sixth-form grants and housing benefit grants – councils have very little discretion over expenditure.
Figure 2 Funding for English local authorities from 2015/16 to 2018/19
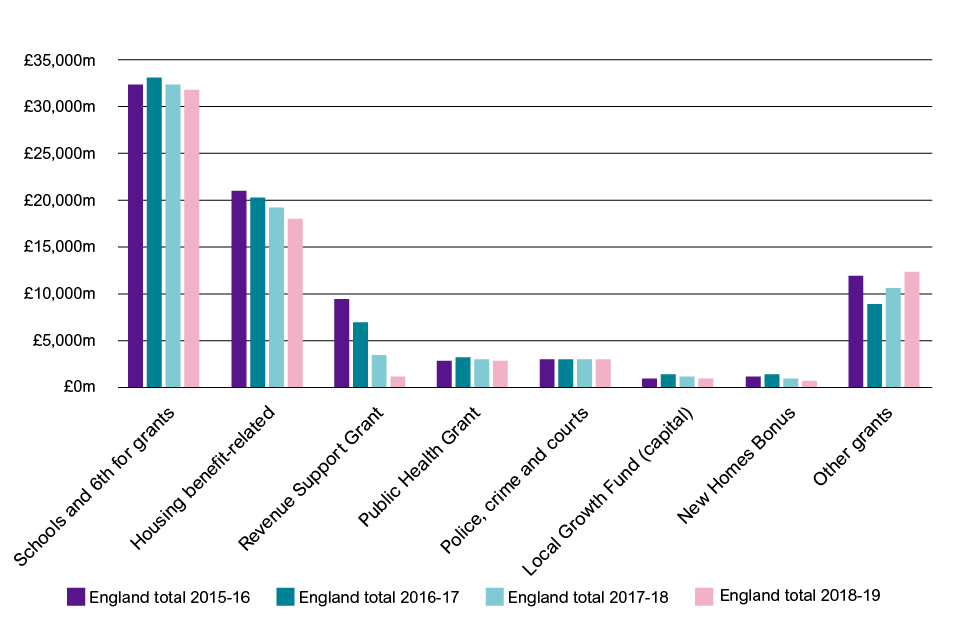
Grants for schools and sixth forms are passed by councils straight on to schools, and only a small proportion of housing benefit-related funding – the housing benefit administration grant – is used by councils to commission and deliver services. The vast majority is paid directly to tenants, with councils acting as delivery agents for central government.
Non-core grants are a disproportionate amount of grant funding
387, or 86 per cent, of the grants issued between 2015/16 and 2018/19 fall into the ‘other’ category, but this category of grants represented £12.43 billion in 2018/19 – only 17.8 per cent of total funding that year.
However, this includes the Improved Better Care Fund and Adult Social Care Support Grant. Once they are removed from this category, it represents only £10.847 billion, or 15.5 per cent of total funding.
Most of the grants issued to local government are small
Grants issued to local government vary widely in size. The largest are over £1 billion. However, over 50 grants – almost one quarter of those issued each year – are worth less than £1 million. Each of these grants equates to less than 0.25 per cent of the budget for a typical metropolitan district or London borough.
These grants are allocated to multiple councils, meaning the amount going to any given council is lower still.
| Total value | 2015/16 | 2016/17 | 2017/19 |
|---|---|---|---|
| Under £1m | 58 | 54 | 54 |
| £1m-£10m | 69 | 67 | 71 |
| £10m-£100m | 66 | 57 | 69 |
| £100m-£500m | 33 | 31 | 35 |
| £500m or more | 22 | 21 | 21 |
| Total value | 2015/16 | 2016/17 | 2017/19 |
|---|---|---|---|
| Under £1m | 23% | 23% | 22% |
| £1m-£10m | 28% | 29% | 28% |
| £10m-£100m | 27% | 25% | 28% |
| £100m-£500m | 13% | 13% | 14% |
| £500m or more | 9% | 9% | 8% |
A large proportion of the grants issued to local government are competitive
From our analysis of a sample of 366 grants [4], we found that almost one third are competitive – that is, councils are only able to access this funding by involvement in a competitive process. By comparison, 7 per cent were allocated to authorities which meet set criteria, and 28 per cent were awarded to councils using a formula.
| Allocation method - short name | Number | Percentage |
|---|---|---|
| Formula | 103 | 28% |
| Competed | 117 | 32% |
| Criteria-based | 27 | 7% |
| Un-competed | 83 | 23% |
| More than one allocation method | 36 | 20% |
| Total | 366 | 100% |
Local government funding is uncertain
Of the approximately 250 grants issued to councils each year between 2015/16 and 2018/19, over one third are discontinued from one year to the next. This includes grants intended for long-term capital projects.
The longevity of grants is often uncertain at the point when they are issued. Our analysis found that, of the 218 grants allocated to councils in 2017/18, over 90 per cent are listed as ending in the same year. However, in practice, two thirds of grants tend to continue onto the next year, which suggests that grants are recorded as ending in the same financial year by default.
Funding is fragmented across both services and departments
The grants issued to local government fall into 22 different service categories. Between 2015/16 and 2018/19, only 18 per cent of the grants issued were intended for more than one service area. The majority were for single, specific services.
These grants are in turn spread across a wide range of issuing bodies. In years analysed, 14 central government departments and 23 non-departmental public bodies issued funding to councils, with grants from agencies making up over one quarter of the total.
The quality of funding data is poor
Local government grant data is recorded across a large range of documents, with significant variations in the way that the details of local authorities and amounts distributed are recorded. As a result, not all departments – including MHCLG and HM Treasury – keep a full and accurate list of the grants provided to local government.
[3] Figures from MHCLG Core Spending Power information
[4] 366 grants (82 per cent of those in our database) were validated for analysis of allocation method, by cross-referencing this data between the Government Grants Register and other sources.
Conclusions
Councils’ services are under strain
A combination of tightening resources and sustained increases in service demand have created strain in councils’ services. Councils’ offer has, necessarily, become more focused and increasingly centred on statutory and acute services, including social care.
As a result, councils are increasingly unable to spend on services such as prevention, which can have negative longer-term consequences and increase the cost of meeting statutory responsibilities, both for councils and other organisations such as the NHS and police.
Responses to reductions in core funding rely on small amounts of targeted funding
In a variety of services, decreases in the funding available for early help have already led to an increased cost to meeting demand. For example, reductions in the main housing benefit grant – reflecting the freeze on the local housing allowance rate – resulted in councils’ homelessness services bearing an additional average cost of between £1.4 million and £3 million.
In response, homelessness services have been issued with a range of short-term, funding solutions, with 12 programmes issued between 2015/16 and 2018/19. In most cases, these programmes are specifically focused on reducing the number of people sleeping rough.
This trend towards targeted funding – traditionally used to fund trials of innovative approaches, but here used to replace steep declines in councils’ core funding – is reflected in the increased number of small, short-term grants available to councils.
There is limited strategic oversight of local government grant funding
Unlike core funding, the smaller grants available to councils often come with highly specific conditions on council spending, made more complex by the involvement of multiple funding bodies. Our analysis identified a wide range of funding procedures across government departments and agencies, including variations in how funding is announced, recorded, published and monitored.
The fragmentation in local government funding undermines central government’s understanding of service delivery as a whole, and of the interactions between service areas. There is limited ability to assess the impact of funding restrictions in one area or department on another, and – as with homelessness – reductions in preventative, core funding from one department may be remedied by crisis-oriented funding from another.
When combined with the conflicting objectives, priorities, funding mechanisms, geographies, and accountability regimes in other services, fragmented local government funding risks driving different parts of the public sector apart rather than bringing them together.
Funding is uncertain
The largely short-term basis for local authority grants has undermined the ability of councils to plan strategically for the long term. It limits time for commissioning, and risks harming the quality and value for money of the service by forcing councils to develop strategies for closing down services in the event that funding is discontinued.
As a result, staff may be hired on short-term contracts, strategies may be reduced in scope, and joint commissioning is also limited, as councils are unable to guarantee certainty to partners.
Councils are also increasingly asked to bid for funding through a competitive process. In many cases, this has led to resources being diverted towards the application process, placing additional stress on an over-stretched system. In many cases, the timescales for application are limited – sometimes as short as one month. As a result, councils risk being drawn into a postcode lottery, where they cannot deliver vital services in the places they are most needed
Without clarity about funding in the future some local authorities will need to prepare for the worst, making decisions which may unnecessarily reduce spending and represent poor value for money in the longer term.
Fragmented funding represents poor value for money
Overall, the increasing fragmentation in local government funding risks impeding value for money – both from the administrative burden it poses on councils, and from the detrimental impact on the outcomes that could be achieved for communities.
A trend towards targeted funding has reduced the ability of councils to flexibly deliver local priorities for local people, and has not led to effective oversight or control of the delivery of central government’s priorities. Instead, it has created a complex system where outcomes and independencies between services are not well understood. This is not efficient, fit for purpose, or sustainable.
Recommendations for central government
Tightening resources and growing demand has created an imperative for public service reform. This requires us to work collaboratively across organisational, professional, and departmental boundaries to achieve better outcomes for citizens and communities.
Flexible, longer-term funding which allows local services to agree on and align their shared outcomes, set clear responsibilities, and integrate services around residents is critical to this.
Recommendation one
Address the significant funding gap facing local government services, in order to ensure that councils are not forced to make difficult decisions about the continued provision of vital, but non-statutory, services.
Recommendation two
Deliver additional funding through primary sources of local government funding rather than individual programmes.
Recommendation three
Reserve targeted funding for transformational purposes, including genuine pilots, with government departments required to make the case for new targeted funding as per existing guidance issued by the Department for Communities and Local Government (DCLG) following the 2010 Spending Review.
Recommendation four
Where pilots are funded, allow sufficient time for them to be carried out, monitored and evaluated. Allow pilots to be open to those councils that want to participate, to reduce the burden of competition and prevent geographical inequalities.
Recommendation five
Work with local government to ensure that monitoring processes for grants are proportionate, transparent, and consistent.
Recommendation six
Ensure long-term certainty by issuing funding through multi-year settlements tied to the life of a parliament.
Recommendation seven
Support the integration of public services by integrating departmental funding processes. Join up funding data and require departments to refer to this data when new policy is developed, and consult fully with other departments and stakeholders to understand the impact on other existing policies. Set up cross-departmental teams to ensure joined-up policy making where appropriate, and ensure that cross-departmental policy outcomes are consistent.
Recommendation eight
Consider savings generated by grants issued on a cross-departmental basis, in addition to the direct cost of grant programmes.
Recommendation nine
Improve allocations and grants data, by introducing departmental consistency in how grants are recorded. Consistently publish allocations details for grants.