Resetting the relationship between local and national government. Read our Local Government White Paper
Climate Change Survey, February 2020

In February 2020 the Local Government Association (LGA) conducted a survey of Directors of Environment or equivalent of all councils in England. The purpose of the survey was both to assess what actions councils have already taken to mitigate and/or adapt to climate change and to ask them what policy changes would enable them to do this in future more effectively. At total of 98 responded – a response rate of 29 per cent.
Summary
Background
In February 2020 the Local Government Association (LGA) conducted a survey of Directors of Environment or equivalent of all councils in England. The purpose of the survey was both to assess what actions councils have already taken to mitigate and/or adapt to climate change and to ask them what policy changes would enable them to do this in future more effectively. At total of 98 responded – a response rate of 29 per cent.
A standard PDF of this document is available to download: Climate Change Survey (pdf)
Key messages
- In relation to transport, respondents asked the LGA to focus on campaigning for policies to support an integrated and sustainable public transport infrastructure, further develop the usage and infrastructure of electric vehicles, and promote active travel such as walking and cycling.
- In relation to waste, respondents asked the LGA to focus on campaigning for policies to support and standardise the household waste recycling system, provide incentives towards the development of a circular or zero waste economy, clarify the role of food waste collection and establish clear standards nationwide for what materials can and should be recycled.
- In relation to housing and planning, respondents asked the LGA to focus on campaigning for policies to enable authorities to introduce more rigorous planning and building regulations, provide funding to enable major energy efficiency retrofit projects, and ensuring that the greatest value can be derived from the Future Homes Standard and the National Planning Policy Framework (NPPF).
- In relation to energy, respondents asked the LGA to focus on campaigning for policies to advance the transition to renewable energy, support community and localised energy projects, and understanding and increasing grid capacity.
- In relation to contingency plans, respondents asked the LGA to focus on campaigning for policies to support increasing flood and heat wave protections and ensure a supportive framework for planning, predicting and responding to future climate related incidents.
- In relation to countryside protection, respondents asked the LGA to focus on campaigning for policies to incentivise carbon sequestration and re-wilding, redesign agricultural subsidies, and enable a balance between the protection of nature and its use for other environmental projects such as renewable energy.
- In relation to nature and biodiversity, respondents asked the LGA to focus on campaigning for policies to support biodiversity net gains, develop blue-green infrastructure and provide funding for the further development of diversity-nurturing habitats.
Key findings
- Nine out of ten local authorities surveyed had declared a Climate Emergency.
- Around 72 per cent of local authorities surveyed were measuring their own scope 1 and 2 emissions, and 36 per cent were measuring their own scope 3 emissions. Around 55 per cent were measuring their area’s scope 1 and 2 emissions, and 23 per cent were measuring their area’s scope 3 emissions.
- Total scope 1 and 2 emissions by local authorities across England is estimated at 2.4 million tonnes of carbon dioxide per year, compared to 135 million tonnes for local authority areas.
- Around 80 per cent of local authorities surveyed had set an official target for the authority to become carbon neutral. Around 60 per cent had set an official target for the area to become carbon neutral.
- Over 80 per cent of responding councils indicated that there was an executive council member of their authority whose portfolio specifies a lead role on climate change.
- Around 62 per cent had a completed or were developing a communications plan for climate change. The most frequent communications activities around climate change included website messaging (96 per cent), local events (73 per cent) and surveys (58 per cent). Around 83 per cent of communications plans included both climate change mitigation and climate change adaptation.
- The areas of expertise and skills most frequently identified as in need of further development were green economic planning (95 per cent) and low carbon procurement and low carbon budgeting (92 per cent).
- The most frequently delivered climate change mitigation projects included installing energy saving measures in the council’s own building stock, electric vehicle charging points, communications campaigns around climate change and small-scale photovoltaic installations.
- Over eight in ten of local authorities surveyed had been affected by a climate related incident in the last five years.
- The most frequently delivered climate change adaptation projects included wildlife protection and biodiversity, sustainable urban drainage, flood awareness campaigns for residents and contingency plans for vulnerable people.
- The organisations most frequently identified as actual or potential partners in combatting climate change included other local authorities, local residents or residents’ groups, energy suppliers and NHS bodies.
- The most frequently identified barrier to tackling climate change was funding (96 per cent), followed by legislation or regulation (93 per cent) and lack of workforce capacity (88 per cent).
- The forms of climate change offered by the LGA or its partners which had the highest awareness among respondents were the Climate local programme (36 per cent), followed by the relevant LGA Councillor Workbook (51 per cent) and LGA Leadership Essentials programme (49 per cent).
- Among respondents who had used each form of LGA support, the one most often identified as useful was LGA events (95 per cent), followed by climate change case studies (88 per cent), other LGA programmes, signposting to useful resources and the LGA councillor workbook (87 per cent).
- The area of potential future LGA support identified most often as useful by the respondents was lobbying for change around funding (92 per cent), followed by lobbying for change in legislation (81 per cent), sector specific good practice guidance on scope 3 emissions (77 per cent), good practice and case studies (76 per cent) and climate change workshops and events (70 per cent).
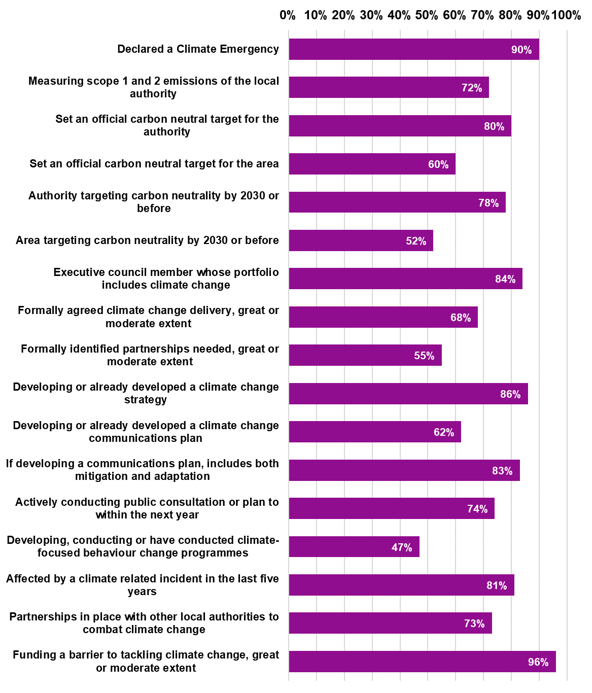
Figure 1. Overview of key findings from the survey
Introduction
In February to October 2020 the Local Government Association (LGA) conducted a survey of Directors of Environment or equivalent of all councils in England. The first purpose of the survey was to assess what actions councils have already taken in relation to climate change- including both mitigation, or reducing climate change, and adaptation, or helping communities to better cope with the effects of climate change. Topics covered included whether their council has declared a climate emergency, the extent to which the council is measuring its carbon footprint and that of its local area, and the target date by which the authority plans to become carbon neutral. The second purpose of the survey was to ask councils what policy changes would enable them to combat climate change in future more effectively, including questions on housing, energy, transport and a variety of other areas.
Methodology
In February 2020, the LGA’s Research and Information Team sent an online survey to all Directors of Environment or equivalent for all councils in England, including district councils, county councils and single-tier councils. It was permitted for Directors to delegate the completion of the survey to another member of staff as appropriate. Of the 339 councils in England, a total of 98 replied – a response rate of 29 per cent.
This level of response rate means that these results should not be taken to be more widely representative of the views of all councils. Rather, they are a snapshot of the views of this particular group of respondents.
The survey was launched just before the United Kingdom’s lockdown in response to COVID-19. In recognition of the extreme pressure which this placed upon councils, the survey was left open for an extended period of time for any councils still able to take part, although participation was not actively promoted. The survey ultimately closed in October 2020, although the final response was in July 2020. Table 1 illustrates the timeframe in which councils responded to the surveys. The competing demands of COVID-19 are one potential explanation for why the response rate was not higher. As the vast majority of respondents (96 per cent) submitted the survey either before or shortly after the start of the United Kingdom’s original lockdown, the following results should be regarded as a “pre-COVID-19” picture of climate change action among local authorities, and should not be assumed to be representative of the participating local authorities’ actions and intentions in subsequent periods.
| Type of authority | Number of responses | % of all responses |
|---|---|---|
| Survey completed before the start of the United Kingdom lockdown on 16 March 2020 | 71 | 72% |
| Survey completed on or after 16 March 2020 and before the end of March | 24 | 24% |
| Survey completed after the end of March 2020 | 3 | 3% |
Note: all responses submitted following the end of March 2020 were submitted in July 2020.
Table 2 shows the response rate by type of council. This demonstrates that the authority type with the highest response rate was county councils, at 56 per cent whilst district councils had the lowest response rate, at 23 per cent.
| Type of authority | Total number | Number of responses | Response rate % |
|---|---|---|---|
| District | 188 | 44 | 23% |
| County | 25 | 14 | 56% |
| London borough | 33 | 9 | 27% |
| Metropolitan district | 36 | 12 | 33% |
| Unitary | 57 | 19 | 33% |
Table 3 shows the response rate by region. This shows that the regions with the joint highest response rate were the South West and the West Midlands, at 39 per cent, whilst the one with the lowest response rate was the East Midlands, at 22 per cent.
| Region | Total number | Number of responses | Response rate% |
|---|---|---|---|
| Eastern | 50 | 14 | 28% |
| East Midlands | 45 | 10 | 22% |
| London | 33 | 9 | 27% |
| North East | 12 | 4 | 33% |
| North West | 41 | 11 | 27% |
| South East | 70 | 16 | 23% |
| South West | 33 | 13 | 39% |
| West Midlands | 33 | 13 | 39% |
| Yorkshire and Humber | 22 | 8 | 36% |
In addition, the following points should be noted about the research methodology:
- Please note that the bases from which percentages were calculated vary throughout the survey, as not all respondents were shown all questions, and all questions were optional, meaning that some respondents chose not to answer them.
- Where figures are grossed for England, calculations have been made on the basis that those answering would be representative of non-responding councils in England.
- Throughout the report percentages in figures and tables may add to more than 100 per cent due to rounding. Percentages are rounded to the nearest whole per cent, and large numerical figures are rounded to the nearest thousand.
Climate Change Survey 2020
This section contains analysis of the full results from the survey.
Declaration of a Climate Emergency
Respondents were asked whether their council had declared or was planning to declare a Climate Emergency at the time of their response. As Table 4 shows, around 90 per cent of respondents’ councils had already declared a Climate Emergency. One council had not declared a Climate Emergency, but had formally agreed plans to declare one. One other council had not yet formally agreed any plans to declare a Climate Emergency, but was considering doing this. Eight councils represented among the respondents of the survey had not declared a Climate Emergency, had no agreed plans to and were not considering putting those in place.
Table 4: Has your authority declared a Climate Emergency?
| Per cent | |
|---|---|
| Yes, already declared | 90% |
| No, but planning to declare | 1% |
| Not planning to declare, but considering | 1% |
| No plans to declare and not considering | 8% |
| Don't know | 0% |
Base: all respondents who answered the question (97 respondents).
Measurement of carbon emissions
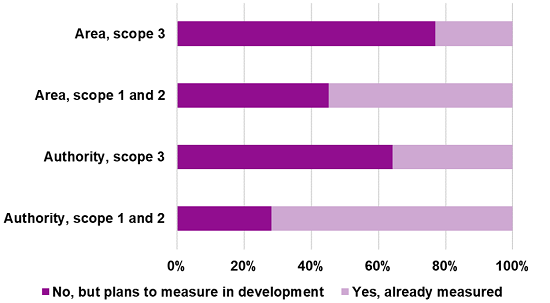
Respondents were asked in a four-part question whether their council already measured or was planning to measure both their own carbon emissions as a local authority, and those of the area over which their authority presided. A distinction was made between scope 1 and 2 emissions (all direct emissions and indirect emissions from purchased electricity respectively) and scope 3 emissions (all other indirect emissions, for example those resulting from business travel, procurement, waste and water)[1]. Table 4 and Figure 2 show the results of this question. For all four types of emissions, all respondents who gave an answer were either already measuring the emissions or were developing plans to measure them in future. The emissions type which the greatest proportion of respondents already measured was the authority’s own scope 1 and 2 emissions (72 per cent), followed by the scope 1 and 2 emissions of the authority’s area (55 per cent), the authority’s scope 3 emissions (36 per cent) and the area’s scope 3 emissions (23 per cent).
[1] For more information, visit What is the Difference Between Scope 1, 2 and 3 Emissions?
| Authority, scope 1 and 2 (per cent) | Authority, scope 3 (per cent) | Area, scope 1 and 2 (per cent) | Area, scope 3 (per cent) | |
|---|---|---|---|---|
| Yes, already measured | 72% | 36% | 55% | 23% |
| No, but plans to measure in development | 28% | 64% | 45% | 77% |
| No, and no current plans to develop measures yet | 0% | 0% | 0% | 0% |
| Don't know | 0% | 0% | 0% | 0% |
| Base (all respondents who answered the question) | 96 | 81 | 73 | 52 |
Figure 2. Is your authority currently measuring, or not measuring, the carbon emissions of the following?
Respondents who indicated that their authority already measures emissions of at least one of the four types was asked to provide the latest emissions measurements, measured in tonnes of carbon dioxide per year, for any of the four types which were available. In all, 58 respondents provided scope 1 and 2 carbon emission measurements for their own authority, 33 provided scope 1 and 2 emissions for their local area, 25 provided scope 3 emissions for their authority, and seven provided scope 3 emissions for their local area. These emissions provided were used to generate overall estimates for each emissions type for England by the following process:
- Authorities were grouped into categories based on both their authority type and their region – for example, district councils in the South West.
- The average was calculated for those who provided data among these categories for each emissions type.
- Councils who did not provide a measurement for a particular emissions type, or did not complete the survey at all, were assigned this average value as an estimate. Where a particular category of council types within a region did not have any emissions measurements provided, the overall average for local authorities of the same type across England was used instead.
- Overall total emissions estimates for England and for each authority type and region were calculated.
Table 6 shows the estimated total emissions from local authorities and their areas, based on the measurements provided by the respondents to the survey. Please note that these are estimates based on a minority of councils which responses, and the estimates for scope 3 measurements for both authorities and local areas have been excluded altogether, for two reasons: a relatively low number of local authorities provided data for these emissions, making any calculation of overall estimates intrinsically unreliable, and the overall scope 3 estimates of both categories produced extreme variations between regions that was almost certainly the result of significantly different measurement methodologies between local authorities, suggesting that these measurements were not directly comparable with each other.
The estimated total for scope 1 and 2 emissions generated by local authorities in England was approximately 2.4 million tonnes of carbon dioxide per year, and the equivalent figure for scope 1 and 2 emissions generated by local areas as a whole was approximately 135 million tonnes of carbon dioxide per year.
Table 6 also displays differences in these estimates by region and authority type. Although variations between these categories for scope 1 and 2 emissions were not as extreme as they were in the case of scope 3 emissions, they are still considerable, suggesting some differences in the methodology used to estimate these emissions between councils.
| Authority, scope 1 and 2 (per cent) | Area, scope 1 and 2 (per cent) | |
|---|---|---|
| Total for England | 2,407,000 | 135,088,000 |
| Total for Eastern | 86,000 | 31,890,000 |
| Total for East Midlands | 48,000 | 10,553,969 |
| Total for London | 283,000 | 7,547,000 |
| Total for North East | 145,000 | 6,970,000 |
| Total for North West | 98,000 | 11,638,000 |
| Total for South East | 149,000 | 31,968,000 |
| Total for South West | 264,000 | 17,153,000 |
| Total for West Midlands | 900,000 | 15,653,000 |
| Total for Yorkshire and Humber | 435,000 | 1,715,000 |
| Total for County | 267,000 | 72,360,000 |
| Total for District | 1,080,000 | 27,905,000 |
| Total for London Borough | 283,000 | 7,547,000 |
| Total for Metropolitan district | 373,000 | 5,913,000 |
| Total for Unitary | 405,000 | 21,363,000 |
| Base (all respondents who answered the question) | 58 | 33 |
Note: estimates have been rounded to the nearest thousand.
Official target for carbon neutrality
Respondents were asked whether their authority has set an official target for becoming carbon neutral for the authority itself, the area as a whole, or both. Table 7 summarises the results of this question, showing that 80 per cent of the respondents who answered the question indicated that their authority has set an official target for its own carbon neutrality, and 60 per cent indicated that their authority has set an official target for its area’s carbon neutrality. Around 39 per cent of respondents indicated that their council has set official targets for both of these, hence why the total of these percentages exceeds 100.
| Per cent | |
|---|---|
| Yes, for the authority itself | 80% |
| Yes, for the area as a whole | 60% |
| No | 0% |
| Don't know | 0% |
Base: all respondents who answered the question (84 respondents). As the question allowed respondents to select all responses that apply, percentages will not necessarily add up to 100.
Respondents who indicated that they have set an official target for becoming carbon neutral were asked to specify the scope of these targets- that is, whether or not they contain scope 3 emissions, as explained above. Those who indicated that their authority has set carbon neutral targets for both itself and its area were asked to answer this question twice, once for each target.
Table 8 shows the results for this question for both authority and area targets. For both target types, just under half of the respondents indicated that their target includes emissions from scope 1, 2 and 3. Around a quarter of respondents indicated that their target includes scope 1 and 2, but not scope 3, with the remainder specifying another form of scope for their targets. In general, respondents selected the “other” option more often when describing the target for their authority’s local area than when describing their authority’s target for itself.
The “other” emissions scopes specified by respondents for their authority’s target can be broken down into the following categories:
- Those including scopes 1, 2 and part of scope 3, in most cases planning to extend the inclusion of scope 3 emissions over time (10 respondents);
- Those as yet undecided (five respondents);
- Those stating that they will measure whatever the available data at a given point in time allows them to (one respondent).
Broadly the same categories can be used to summarise the “other” descriptions provided by respondents for their area’s target:
- Scope 1, 2 and part of scope 3, expanding the latter over time (five respondents);
- As yet undecided (four respondents);
- Inclusion depends on the available data (four respondents).
| Authority's target: number | Authority's target: per cent | Area's target: number | Area's target: per cent | |
|---|---|---|---|---|
| Includes scope 1, 2 and 3 emissions | 30 | 47% | 20 | 45% |
| Scope 1 and 2 emissions only | 18 | 28% | 11 | 25% |
| Other (please specify below) | 16 | 25% | 13 | 30% |
| Don't know | 0 | 0% | 0 | 0% |
| Base (all respondents who answered the question) | 64 | 100% | 44 | 100% |
Respondents who indicated that their authority has set an official carbon neutral target for itself, its area, or both were asked to specify the date or dates by which the authority and/or the area are targeted to become carbon neutral. As Table 9 shows, the most common single year specified as a target was 2030, alone accounting for 69 per cent of authorities’ targets for themselves. Targets specified for whole local areas tended to be distributed later than targets for local authorities themselves, with an even division between targets set for 2030 and targets set for after that year. For both authority and area targets, only a small minority of respondents provided carbon neutral targets with a target date before 2030.
| Authority's target: number | Authority's target: per cent | Area's target: number | Area's target: per cent | |
|---|---|---|---|---|
| Before 2030 | 6 | 9% | 2 | 4% |
| 2030 | 46 | 69% | 24 | 48% |
| After 2030 | 15 | 22% | 24 | 48% |
| Base (all respondents who answered the question) | 67 | 100% | 50 | 100% |
Corporate climate change measures
Respondents were asked whether there is an executive council member of their authority whose portfolio specifies a lead role on climate change. As Table 10 shows, around 84 per cent of respondents indicated that their council has a portfolio holder for climate change within its executive.
| Per cent | |
|---|---|
| Yes | 84% |
| No | 16% |
| Don't know | 0% |
Base: all respondents who answered the question (93 respondents).
Respondents were asked the extent to which their authority has formally agreed what it is going to deliver around climate change. Table 11 shows that 68 per cent of respondents indicated that their authority has formally agreed its climate change delivery to either a great or a moderate extent, and only seven per cent of respondents indicated that their authority has not formally agreed anything at all in this area.
| Per cent | |
|---|---|
| To a great or moderate extent | 68% |
| To a great extent | 29% |
| To a moderate extent | 39% |
| To a small extent | 25% |
| Not at all | 7% |
| Don't know | 0% |
Base: all respondents who answered the question (97 respondents).
Respondents were asked the extent to which their authority had formally agreed which areas of action around climate change will require the support of partners to deliver. As Table 12 shows, over half of respondents indicated that this applies to either a great or a moderate extent, and only 13 per cent indicated that this does not apply to their local authority at all.
| Per cent | |
|---|---|
| To a great or moderate extent | 55% |
| To a great extent | 18% |
| To a moderate extent | 37% |
| To a small extent | 33% |
| Not at all | 13% |
| Don't know | 0% |
Base: all respondents who answered the question (95 respondents).
Climate change strategy
Respondents where asked whether their authority has an agreed and up to date climate change strategy. Around 29 per cent of respondents indicated that they have a climate strategy and that it is already being delivered, with a further 12 per cent who have a completed strategy that is not yet being delivered, and a further 45 per cent with a strategy that is not yet completed but currently in development. Together, these responses add up to 86 per cent of respondents who answered this question.
| Per cent | |
|---|---|
| Yes, already being delivered | 29% |
| Yes, completed but not yet being delivered | 12% |
| No, but currently in development | 45% |
| No, but planning to produce one | 13% |
| No, and no current plans to produce one yet | 1% |
| Don't know | 0% |
Base: all respondents who answered the question (95 respondents).
All respondents other than those without a strategy and with no plans to produce one were asked whether specific financial resources have already been secured to implement the strategy. As Table 14 shows, although only four per cent of respondents indicated that their council had already secured enough financial resources to implement their entire strategy, 62 per cent indicated that they had secured some of the required financial resources. A further 34 per cent indicated that they had not yet secured any of the required financial resources to implement their strategy.
| Per cent | |
|---|---|
| Yes, all of the resources required to implement it | 4% |
| Yes, some of the resources required to implement it | 62% |
| No | 34% |
| Don't know | 0% |
Base: all respondents who indicated that their authority has a climate change strategy or that one is in development or being planned, and who answered this question (92 respondents).
All respondents who indicated that their authority has already secured some or all of the financial resources required to implement their strategy were asked to specify when the funding already secured will first be provided. This question was split between mitigation and adaptation activities, in case any difference in the provision of funding existed between them. As Table 15 shows, the most frequent period in which funding would be first provided was the financial year 2020/21, with slightly smaller proportions of respondents indicating that the funding was already available in 2019/20. Very small proportions of respondents indicated that the funding already secured would first become available after 2020/21. The relative proportions were very similar between mitigation and adaptation activities.
| Mitigation: number | Mitigation: per cent | Adaptation: number | Adaptation: per cent | |
|---|---|---|---|---|
| Already in place as of 2019/20 | 25 | 42% | 17 | 43% |
| 2020/21 | 31 | 52% | 19 | 48% |
| In the following five financial years | 3 | 5% | 2 | 5% |
| Beyond the following five financial years | 1 | 2% | 2 | 5% |
| Don't know | 0 | 0% | 0 | 0% |
| Base (all respondents who answered the question) | 60 | 100% | 40 | 100% |
Respondents who indicated that they have already secured the funding to implement their strategy were asked to estimate the approximate amount of funding already secured within a range of time periods. Only two respondents provided an answer to this question, meaning that it was not possible to calculate reliable overall estimates for all authorities[1].
All respondents were asked to estimate the approximate amount of additional funding, not including any already secured, that would be required to implement to implement climate change measures over a range of time periods. These time periods were cumulative, with, for example, the funding required for the next five financial years also included within the funding required for the next ten financial years. Between 13 and 18 respondents provided responses to this question, varying depending on the time period in question[2]. This small number of responses means that the overall estimates below must be treated with caution, and also means that attempting to produce estimates for specific regions or authority types would be inadvisable as they would not be reliable. To prevent very high values from skewing the overall estimates, the median figure among responding authorities has been used instead of the mean[3]. The estimated totals were calculated simply by multiplying these median figures by 339, the current number of councils in England.
Table 16 shows the estimates for England for additional funding required in the next five and ten and fifteen financial years. Respondents were also asked to provide estimates for the next fifteen and twenty financial years, but as only a small number of respondents provided these figures overall estimates have not been provided. As this shows, the estimated additional funding, not including funding already secured, required by local authorities to deliver their climate change strategies in the next five financial years was around £678 million, and the figure for the next ten financial years was around £6.7 billion.
[1] Both respondents provided figures only for funding already in place as of 2019/20. The first authority indicated that £50,000 of funding was already in place, and the second indicated that £2,600,000 of funding was already in place. Due to the sparsity of data provided for this question, these figures should be strictly taken as indicative only of two individual councils, and it should not be assumed that these are in any way representative of other local authorities.
[2] Some respondents provided data for an earlier time period but not a later one, for example, the next five financial years but not the next ten financial years. Because subsequent figures are cumulative and include all previous figures, it was possible to assume that these later figures would be at least as great as the figure immediately before them, and so the estimate for the previous period was copied into the estimate for the subsequent period. The fact that, in these cases, there was no increase in the total amount of additional funding required, which in practice is unlikely, means that these estimates are intrinsically conservative in nature.
[3] For more information on this, see https://statistics.laerd.com/statistical-guides/measures-central-tendency-mean-mode-median.php
Table 16: Please estimate the approximate amount of additional funding (i.e. not including funding already secured) that will be required to implement climate change measures over the following time periods. Please make your estimates cumulative, and provide the total amount required, not the amount required per year.
| The next five financial years | The next ten financial years | |
|---|---|---|
| Median per responding authority | £2,000,000 | £20,000,000 |
| Estimated total | £678,000,000 | £6,780,000,000 |
| Base (all respondents who answered the question) | 13 | 19 |
Note: numbers have been rounded to the nearest thousand.
Communications plan for climate change
All respondents were asked whether their authority has a communications plan for climate change. As Table 17 shows, around 62 per cent of respondents indicated that their authority has a communications plan that is either completed or in development, including 13 per cent who indicated that their communications plan is being delivered and a further eight per cent who indicated that their communications plan is complete, although not yet being delivered. A further 31 per cent indicated that their authority was planning to produce a communications plan for climate change, though such a plan was not yet in development. Only 7 per cent of respondents indicated that their authority has no communications plan for climate change and no plans to produce one yet.
| Per cent | |
|---|---|
| Yes, being delivered | 13% |
| Yes, completed but not yet being delivered | 8% |
| No, but in development | 41% |
| No, but planning to produce one | 31% |
| No, and current plans to produce one yet | 7% |
| Don't know | 0% |
Base: all respondents who answered the question (95 respondents).
Respondents were asked to indicate which of a range of communications activities their authority was undertaking or planning to undertake around climate change. Respondents were able to select all activities which applied to them. As Table 18 shows, the most frequently cited communications activities were website messaging (96 per cent), local events (73 per cent) and surveys and parish and town council engagement (both 58 per cent).
Table 18: Which of the following communications activities are you undertaking or planning to undertake around climate change? Please select all that apply.
| Per cent | |
|---|---|
| Website messaging | 96% |
| Local events | 73% |
| Surveys | 58% |
| Parish and town council engagement | 58% |
| Citizens or youth assemblies and juries | 51% |
| Blog activity | 25% |
| Other (please specify below) | 45% |
| None of the above | 0% |
Base: all respondents who answered the question (89 respondents).
Of the 40 respondents who selected the “other” option, 39 provided textual comments to clarify the nature of these activities. The activities which they mentioned can be grouped into the following categories, with some individual comments accounting for more than one category:
- Community engagement, for example community wardens or engaging with schools (10 respondents);
- Social media activity (seven respondents);
- Partnerships with other organisations (six respondents);
- Newspaper communications (four respondents);
- Not known by the respondent (four respondents);
- Training courses and activities (three respondents);
- Activities similar to citizens or youth assemblies and juries (two respondents);
- A collection of activities mentioned by one respondent each:
- All of the above of the activity options provided;
- Behavioural insights (see below);
- Case studies;
- Conferences;
- Consultations (see below);
- Infographics;
- Internal comms;
- Lobbying;
- Workshops;
- None of the above[1].
[1] The respondent in question presumably did not see the predefined option for this answer.
Respondents who indicated that their authority has a communications plan for climate change which is being delivered, completed, in development or in planning were asked to specify whether the communications plan covers climate change mitigation, climate change adaptation, or both. As Table 19 shows, over 80 per cent of respondents who answered this question indicated that their communications plan includes both climate change mitigation and climate change adaptation. The remainder indicated that their communications plan covers only climate change mitigation. No respondent indicated a communications plan that covered only climate change adaptation.
| Per cent | |
|---|---|
| Both mitigation and adaptation | 83% |
| Mitigation only | 18% |
| Adaptation only | 0% |
Base: all respondents who answered the question (80 respondents).
Respondents were asked whether their authority was conducting public consultation on climate change. Table 20 demonstrates that 74 per cent of respondents’ councils are either already actively conducting public consultation on climate change or are planning to do this within the next year. Around 17 per cent of respondents indicated that their council is not doing this and has no current plans to.
| Per cent | |
|---|---|
| Yes, actively | 43% |
| No, but plan to do this within the next year | 31% |
| No, but plan to do this in a year or more | 9% |
| No, and no current plans to do this yet | 17% |
| Don't know | 0% |
Base: all respondents who answered the question (90 respondents).
Respondents were asked whether their authority has conducted any behaviour change programmes on climate change. As Table 21 shows, around 47 per cent of respondents who answered the question indicated that they either have conducted, were conducting or were developing behaviour change programmes in this area. A further 32 per cent were planning to develop such behaviour change programmes, and the remaining 21 per cent indicated that their local authority had no plans to develop these at present.
| Per cent | |
|---|---|
| Yes, complete or currently being conducted | 22% |
| Not yet being conducted, but currently in development | 25% |
| No, but planning to develop | 32% |
| No, and no current plans to conduct any yet | 21% |
| Don't know | 0% |
Base: all respondents who answered the question (91 respondents).
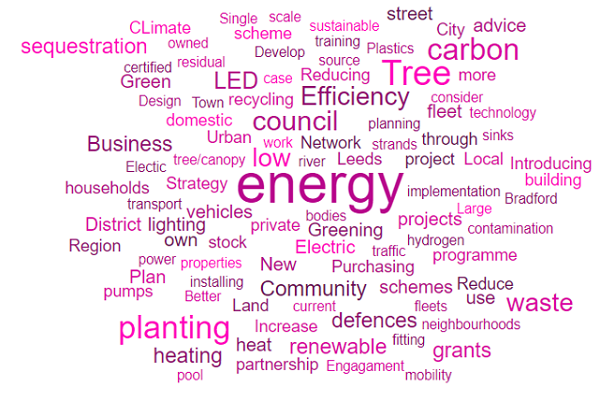
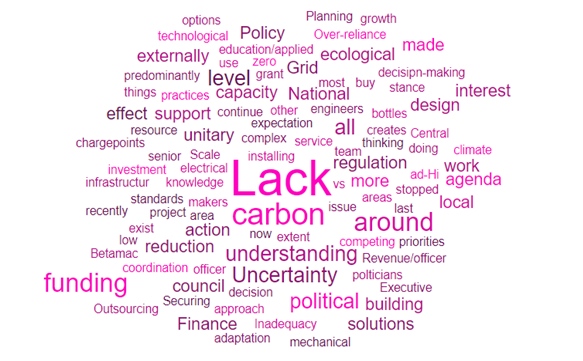
Respondents who indicated that their authority had completed or was currently conducting, developing or planning behaviour change programmes on climate change were asked to specify the nature and any results of these programmes in an open text box. A total of 48 respondents provided text, of which 45 provided sufficient detail for their behaviour change programme to be classified and understood. In many cases a single textual response provided information on multiple themes relating to climate change behaviour change programmes. The most prevalent themes were as follows:
- Projects aimed externally, at the general public (31 respondents). For example, “Incentives to encourage you to try greener, cheaper and healthier ways of getting from A to B, including the opportunity to speak to a Travel Advisor about all the travel options available for the regular journeys you make.”
- Projects aimed externally, at council staff and other stakeholders (29 respondents). For example, “Go Green at Work behaviour change programme run for 6 years... Team-based competition encouraging staff to complete tasks and win awards, based on the NUS Green Impact model. 64 teams, around £44,600 savings, 171 tonnes of CO2 saved.”
- Projects related to transport (22 respondents). For example, “new staff travel action plan - to shift travel for and to work to low carbon modes.”
- Projects related to waste (13 respondents). For example, “Already launched initiatives to use reusable water bottles across city and cups in Council.”
- Projects related to energy efficiency (eight respondents). For example, “Internal programme to encourage energy efficiency. Resulted in immediate drop in primary energy consumption.”
- Projects related to renewable energy (seven respondents). For example, “Collective energy supplier switches.”
- Projects related to carbon literacy (four respondents);
- Projects related to overall carbon footprint measurement and reduction (four respondents);
- Projects related to flood prevention (three respondents);
- Projects related to food (three respondents);
- Projects related to reducing unnecessary car idling (two respondents);
- Projects related to helping people develop environmentally conscious consumption habits (two respondents);
- A collection of projects mentioned by one respondent each:
- Air quality;
- Carbon literacy;
- Climate champions;
- Parks;
- Partnerships;
- Residential;
- Water;
- Young people.
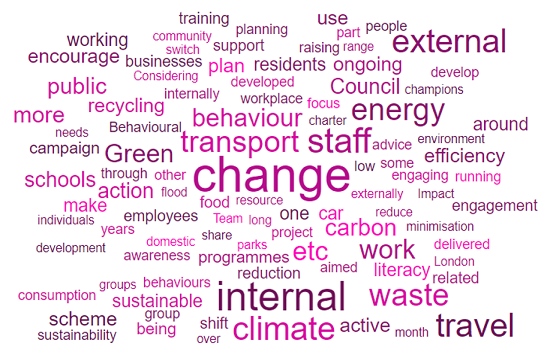
Figure 3 shows a word cloud visualising the relative frequency of words provided by respondents in response to this question[1].
[1] Acknowledgements to https://worditout.com/ for the generator used to create this and all subsequent word clouds in this publication.
Figure 3. Please briefly specify the nature and any results of the behaviour change programme(s), and whether they are completed or still in progress. In particular, please specify whether the behaviour change programme(s) are internal - aimed at employees of the authority - or external - aimed at the general public.
Respondents were asked to specify which, if any, of a range of areas of expertise or skills were in need of further development within their authority in relation to climate change work. For each area of expertise or skill, respondents could either indicate that further development was needed, that further development was not needed because expertise or skills were already sufficient, or that further development was not needed because the area of expertise or skill was not needed by the authority.
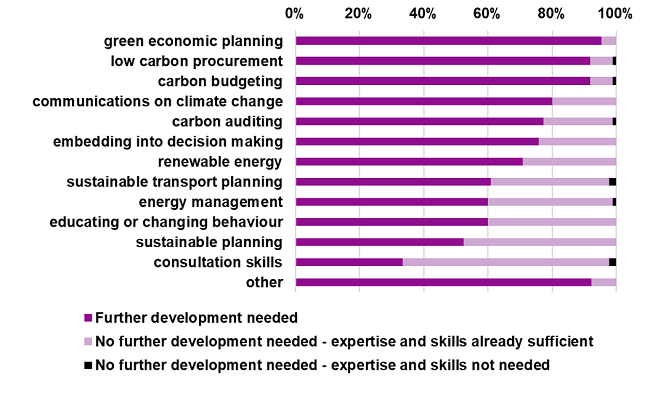
As Table 22 and Figure 4 show, the area of expertise or skill which respondents most often reported needed further development within their authority was green economic planning, at 95 per cent, followed by low carbon procurement and carbon budgeting, both at 92 per cent, communications on climate change, at 80 per cent, and carbon auditing, at 77 per cent. The area of expertise or skill which the most respondents indicated was already sufficient within their authority was consultation skills, at 64 per cent. Only very small proportions of respondents indicated that any of the skills were not needed within their authorities.
Figure 4. Which, if any, of the following areas of expertise or skills do you feel your authority needs to develop further, in relation to climate change work?
| Further development needed (per cent) | Expertise and skills already sufficient (per cent) | Expertise and skills not needed (per cent) | Base (all respondents who answered the question) | |
|---|---|---|---|---|
| Green economic planning | 95% | 5% | 0% | 87 |
| Low carbon procurement | 92% | 7% | 1% | 87 |
| Carbon budgeting | 92% | 7% | 1% | 86 |
| Communications on climate change | 80% | 20% | 0% | 90 |
| Carbon auditing | 77% | 22% | 1% | 88 |
| Embedding carbon considerations into decision making | 76% | 24% | 0% | 91 |
| Renewable energy | 71% | 29% | 0% | 89 |
| Sustainable transport planning | 61% | 37% | 2% | 87 |
| Energy management | 60% | 39% | 1% | 90 |
| Educating the public/changing public behaviour | 60% | 40% | 0% | 90 |
| Sustainable urban/town/rural planning | 52% | 48% | 0% | 86 |
| Consultation skills | 33% | 64% | 2% | 87 |
| Other area(s) of expertise or skills (please specify) | 92% | 8% | 0% | 13 |
The twelve additional areas of expertise or skills in need of further development as specified by respondents can be grouped into the following categories:
- Finance, chiefly relating to methods of obtaining funding (five respondents);
- Carbon offsetting and sequestration (four respondents);
- Climate change adaptation methods and reporting (three respondents);
- Investment and divestment for ecological motives (two respondents);
- Whole systems sustainability design and development (two respondents);
- A collection of areas of expertise or skills mentioned by one respondent each:
- Addressing strategic environmental challenges;
- Carbon accountancy;
- Eco-literacy appraisals;
- Retraining;
- Scope 3 emissions;
- Sustainability-proofed technology.
Climate change mitigation project areas delivered
Respondents were asked to indicate which of a series of climate change mitigation project areas their authority had delivered in the last ten years, was delivering currently, or planned to deliver in future. Respondents could select any answer that applied, including multiple responses for each mitigation project area.
Table 23 shows the responses as percentages of the total number of respondents to this question. It shows that the most frequently selected mitigation project areas overall included installing energy saving measures in the council’s own building stock, electric charging points, communications campaigns around climate change and small-scale solar photovoltaic installations. The most frequent project areas delivered in the last ten years were energy saving measures in the council’s own building stock (64 per cent), small scale solar photovoltaic installations (58 per cent) and electric charging points (52 per cent). The most frequent project delivered at the time the survey took place were similar, although small-scale solar photovoltaic installations decreased to 26 per cent, electric charging points increased to 54 per cent, and communications campaigns around mitigation increased to 42 per cent. The most prevalent mitigation project areas planned for the next two years were communications campaigns around climate change (55 per cent), large-scale photovoltaic installations (31 per cent) and small-scale photovoltaic installations (29 per cent). In terms of planned mitigation project areas for the longer term, the most prevalent were ground source heat pumps (40 per cent), large-scale solar photovoltaic installations (29 per cent) and introducing hybrid or electric buses on bus routes (23 per cent).
Table 23: Which, if any, of the following climate change mitigation project areas has your authority delivered in the last ten years, is delivering currently, or plans to deliver in the next ten years? You may select more than one response for each project area.
| Have previously delivered in the last ten years | Delivering currently | Plan to deliver in the next two years | Plan to deliver in the longer term | |
|---|---|---|---|---|
| Wind energy | 8% | 1% | 5% | 20% |
| Ground source heat pumps | 16% | 11% | 20% | 40% |
| Small-scale solar photovoltaic instillations (less than 1MW) | 58% | 26% | 29% | 18% |
| Large-scale solar photovoltaic installations (1MW or greater) | 13% | 7% | 31% | 29% |
| Solar water heating | 18% | 3% | 12% | 20% |
| Energy from waste | 26% | 21% | 10% | 18% |
| Combined heat and power (excluding waste schemes) | 25% | 16% | 9% | 15% |
| Energy from biomass | 22% | 10% | 4% | 22% |
| Biofuels or biogass | 4% | 7% | 8% | 16% |
| Energy saving measures in the council's own building stock | 64% | 45% | 31% | 20% |
| Energy saving measures in community buildings | 41% | 24% | 19% | 19% |
| Increasing bus routes | 11% | 13% | 13% | 13% |
| Introducing hybrid or electric buses on bus routes | 8% | 5% | 22% | 23% |
| Electric charging points | 52% | 54% | 34% | 19% |
| Communications campaigns around mitigation | 26% | 42% | 55% | 19% |
| Divestment from companies posing an environmental risk | 4% | 7% | 23% | 12% |
| One or more other mitigation project areas | 12% | 21% | 20% | 14% |
Base: all respondents who answered this question (91 respondents).
The other mitigation project areas specified by the respondents were grouped into the following broad categories, some of which were variations on the options provided in the questionnaire:
- Carbon sequestration, carbon sinks and tree planting (18 respondents);
- Energy efficiency (18 respondents);
- Renewable energy (13 respondents);
- Electric or low carbon vehicles (10 respondents);
- Recycling and waste reduction (seven respondents);
- LED street lighting (five respondents);
- Heat pumps (three respondents);
- A collection of other project areas mentioned by one respondent each:
- Renewable IT technology;
- Carbon literacy;
- Low carbon procurement.
Figure 5 shows the relative frequency of words included in the comments around other mitigation project areas employed.
Figure 5. Which, if any, of the following climate change mitigation project areas has your authority delivered in the last ten years, is delivering currently, or plans to deliver in the next ten years? Other climate change mitigation project areas (please specify).
Flooding and other climate related incidents
Respondents were asked to estimate the number of properties in their authority’s area which had been affected by flooding in the last five years. As flood risk affects specific locations far more severely than others, it would be unreliable and potentially misleading to attempt to estimate this figure for councils which did not provide it, and as such Table 23 below provides the total number of properties only among those authorities which participated in the survey and provided data for this question. This means that these figures are likely to be conservative estimates of the total number of properties affected by flooding across England in the time period specified.
As Table 24 shows, the total of the estimates provided by respondents was just over 23,000 properties in England affected by flooding in the last five years.
| Average per authority | Total | |
|---|---|---|
| Total for England | 236 | 23,200 |
| Total for Eastern | 701 | 6,500 |
| Total for East Midlands | 34 | 300 |
| Total for London | 0 | 0 |
| Total for North East | 0 | 0 |
| Total for North West | 696 | 7,700 |
| Total for South East | 95 | 1,500 |
| Total for South West | 27 | 400 |
| Total for West Midlands | 180 | 2,300 |
| Total for Yorkshire and Humber | 553 | 4,400 |
| Total for County | 701 | 9,800 |
| Total for District | 59 | 2,603 |
| Total for London Borough | 0 | 0 |
| Total for Metropolitan District | 364 | 4,370 |
| Total for Unitary | 336 | 6,375 |
Base: all respondents who answered the question (63 respondents). Note: average estimates have been rounded to the nearest whole number and total estimates have been rounded to the nearest hundred.
Respondents were asked whether their authority’s local area had been affected by a climate related incident in the past five years. As Table 25 shows, over 80% of respondents reported that their authority’s local area had been affected by a climate related incident in this time.
| Per cent | |
|---|---|
| Yes | 81% |
| No | 19% |
| Don't know | 0 |
Base: all respondents who answered the question (70 respondents).
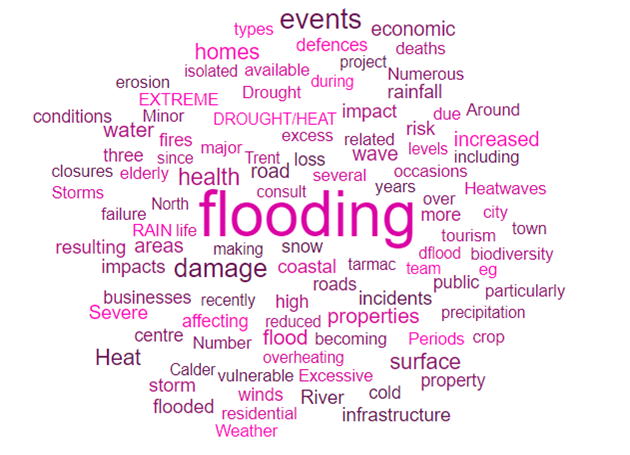
Those respondents who indicated that there had been a climate related incident were asked to briefly specify the nature and consequences of this incident in an open text box. In all, 55 respondents provided textual information of this nature. Their responses raise the following themes, with a single response often raising multiple themes:
- Flooding (49 respondents);
- Heatwaves (10 respondents);
- Cold weather and snow (seven respondents);
- Heavy rain and storms (six respondents);
- Drought and crop failure (four respondents);
- Erosion and coastal damage (three respondents);
- Fires (three respondents);
- Winds (three respondents);
- Biodiversity changes (one respondent).
Figure 6 shows the relative frequency of words mentioned in these comments.
Figure 6. Please briefly describe the nature and consequences of the climate related incident(s).
Climate change adaptation project areas delivered
Respondents were asked to indicate which of a series of climate change adaptation project areas their authority had delivered in the last ten years, was delivering currently, or planned to deliver in future. Respondents could select any answer that applied, including multiple responses for each adaptation project area.
Table 26 shows the responses as percentages of the total number of respondents to this question. It shows that the most prevalent adaptation project areas overall were wildlife protection and biodiversity, sustainable urban drainage, flood awareness campaigns for residents and contingency plans for vulnerable people. Among projects delivered in the last ten years, the most prevalent project areas were installation of flood defences (52 per cent), flood awareness campaigns for residents (52 per cent), and sustainable urban drainage (48 per cent). Among projects delivered at the time of the survey, the most prevalent were wildlife protection and biodiversity (50 per cent), sustainable urban drainage (47 per cent) and minimum flood resilience criteria for new developments (39 per cent). Among projects to be delivered in the next two years, the most prevalent were future proofing new buildings against climate change (34 per cent), wildlife protection and biodiversity (32 per cent) and sustainable urban drainage (23 per cent). Finally, among projects to be delivered in the longer term, the most prevalent project areas were future proofing new buildings against climate change (24 per cent), contingency plans for the wider community (23 per cent) and contingency plans for vulnerable people (22 per cent).
Table 26: Which, if any, of the following climate change adaptation project areas has your authority delivered in the last ten years, is delivering currently, or plans to deliver in the next ten years? You may select more than one response for each project area.
| Have previously delivered in the last ten years | Delivering currently | Plan to deliver in the next two years | Plan to deliver in the longer term | |
|---|---|---|---|---|
| Flood awareness campaigns for residents | 52% | 33% | 18% | 13% |
| Heat wave awareness campaigns for residents | 36% | 11% | 19% | 17% |
| Contingency plans for vulnerable people in heat waves, flooding etc | 35% | 38% | 22% | 22% |
| Contingency plans for the wider community in heat waves, flooding etc | 34% | 34% | 22% | 23% |
| Minimum flood resilience criteria for new developments in flood-risk areas | 28% | 39% | 20% | 14% |
| Future proofing new buildings against climate change | 20% | 26% | 34% | 24% |
| Sustainable urban drainage | 48% | 47% | 23% | 19% |
| Installation of flood defences | 52% | 28% | 17% | 13% |
| Wildlife protection and biodiversity | 45% | 50% | 32% | 20% |
| One or more adaptation projects | 11% | 10% | 6% | 5% |
Base: all respondents who answered this question (88 respondents).
Partnerships to reduce carbon emissions
Respondents were asked whether their authority had existing or planned partnerships with a range of other organisations. As Table 27 shows, the type of organisations which authorities most often had existing or planned partnerships with were other local authorities, followed by local residents or residents’ groups, energy suppliers and NHS bodies. Partnerships already in place tended to outnumber planned partnerships and areas with no planned partnership.
Table 27: Does your authority have partnerships in place, or plans to put partnerships in place, with any of the following bodies to reduce carbon emissions? Please select all that apply.
| Partnership in place | Partnership planned in future | No planned partnership currently | |
|---|---|---|---|
| Other local authorities | 73% | 22% | 9% |
| NHS bodies | 27% | 34% | 23% |
| Local residents or residents' groups | 36% | 46% | 14% |
| Private landlords | 17% | 34% | 24% |
| Registered social landlords | 29% | 36% | 18% |
| Local Partnerships | 40% | 27% | 14% |
| Carbon Trust (CT) | 11% | 13% | 47% |
| Energy Saving Trust Advice Centre | 9% | 16% | 44% |
| Energy suppliers | 36% | 27% | 26% |
| Energy generators | 20% | 23% | 30% |
| Commercial consultancies | 29% | 14% | 32% |
| Anthesis (SCATTER) | 22% | 14% | 23% |
| Local/regional energy efficiency agencies (e.g. Energy Action Devon) | 36% | 13% | 24% |
| Other local partners/community groups | 40% | 33% | 8% |
| Other organisations (please specify) | 23% | 2% | 3% |
Base: all respondents who answered this question (90 respondents).
Twenty-seven respondents provided examples of other organisations which they have actual or planned partnerships with[1]. Some of these examples were variations on the options already provided above, and some respondents listed multiple other organisations. A list of the organisations provided is as follows:
- Energy efficiency partnerships or hubs (five respondents);
- Local Enterprise Partnerships (LEPs) (five respondents);
- Local universities (five respondents);
- Association of Local Energy Officers (ALEO) (two respondents);
- Climate Change or Climate Action Networks (two respondents);
- Energy companies or networks (two respondents);
- The Environment Agency (two respondents);
- Campaigning groups (two respondents);
- Local schools (two respondents);
- Water companies (two respondents);
- A collection of organisations which were mentioned by one respondent each:
- The Association for Public Service Excellence (APSE);
- The Association of Directors of Environment, Planning and Transport (ADEPT);
- Banks and lenders;
- A Chamber of Commerce;
- A City Climate Board;
- A Community Benefit Energy Society;
- Council-owned companies;
- Green Business Groups;
- Local charities;
- Local Nature Partnerships;
- Parish councils;
- Pension funds;
- Police and Crime Commissioners (PCCs);
- Regional Flood Committees;
- Switch and Save Energy Projects.
[1] These textual examples were provided only by those with existing or planned partnerships, not by those who ticked “Other organisations” and stated that they had no planned partnership.
Barriers to tackling climate change
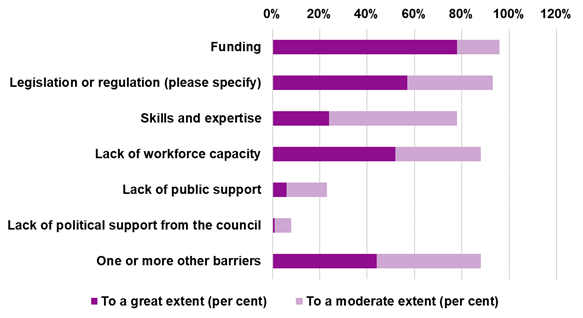
Respondents were asked the extent to which a variety of factors were a barrier to their authority tackling climate change. As Table 28 and Figure 7 show, the most frequently reported barriers were funding, followed by legislation or regulation and lack of workforce capacity. Only small numbers of respondents identified lack of public support and lack of political support from the council as significant barriers to tacking climate change. Respondents also provided a significant number of additional barriers in the provided open text boxes.
| To a great extent (per cent) | To a moderate extent (per cent) | To a small extent (per cent) | Not at all (per cent) | Base (all respondents who answered the question) | |
|---|---|---|---|---|---|
| Funding | 78% | 18% | 3% | 0% | 87 |
| Legislation or regulation (please specify) | 57% | 36% | 4% | 3% | 74 |
| Skills and expertise | 24% | 54% | 19% | 2% | 90 |
| Lack of workforce capacity | 52% | 36% | 11% | 1% | 90 |
| Lack of public support | 6% | 17% | 39% | 38% | 77 |
| Lack of political support from the council | 1% | 7% | 27% | 65% | 86 |
| One or more other barriers | 44% | 44% | 6% | 6% | 18 |
Figure 7. To what extent or not are the following factors a barrier to your authority tackling climate change? Percentages answering to a great or to a moderate extent.
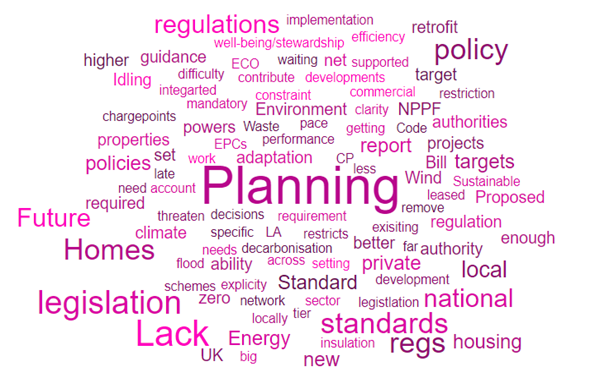
Respondents who identified legislation or regulation as a barrier to tackling climate change were asked to specify which pieces of legislation or regulation were presenting such barriers. A total of 46 respondents provided open text comments in response, of which 45 were able to be classified into different categories of legislation or regulation. The categories which emerged were as follows:
- Building regulations, generally regarded as insufficiently rigorous in environmental terms (twelve respondents);
- The National Planning Policy Framework (NPPF) or planning legislation, also regarded as insufficiently ambitious (eleven respondents);
- The Future Homes Standard, one concern about which being that it prevents work on existing properties being integrated into new developments (four respondents);
- The Environment Bill 2020, which respondents felt had a lack of clarity in its contents and interpretation (two respondents);
- Idling legislation (two respondents);
- A lack of financial incentives for private properties to retrofit (two respondents);
- A lack of requirement for local authorities to report emissions or climate adaptation measures to the public and the government (two respondents);
- A collection of barriers which were identified by one respondent each:
- Billing arrangements on Combined Heat and Power schemes
- Distribution Network Operators
- Energy Company Obligation (ECO) criteria
- Energy efficiency enforcement standards
- Energy network regulation
- Insufficient devolution of powers
- Insufficient flood adaptation powers
- Lack of clear heat decarbonisation policy
- Lack of local authority specific drivers, targets and guidance
- Lack of policies underpinning national net zero legislation
- Carbon taxation
- Waste and recycling policies and legislation
Figure 8 shows the relative frequency of words provided in relation to legislative and regulatory barriers.
Figure 8. To what extent or not are the following factors a barrier to your authority tackling climate change? Legislation and regulation (please specify).
Respondents were also asked to specify which other barriers exist to their authority tackling climate change. A total of 17 respondents provided a variety of other factors, some of which represented variations on the barriers provided above. The additional barriers provided by respondents were as follows:
- A lack of a coordinated strategy, either locally or nationwide (five respondents);
- A lack of specialised knowledge (four respondents);
- Funding difficulties (three respondents);
- Barriers or uncertainty due to local authority reorganisation (two respondents);
- A lack of executive member awareness or understanding (two respondents);
- Electricity grid capacity issues (two respondents);
- A lack of technological solutions which are proven and affordable, as opposed to emerging and experimental (two respondents);
- Some contradictions presented by different areas of policy, for example, policies around economic growth contradicting policies around climate change (two respondents);
- A collection of barriers which were reported by one respondent each:
- Central government funding;
- Lack of a dedicated officer;
- Lack of political support from the council;
- Market regulation;
- Emissions measurement uncertainty;
- Outsourcing increasing complexity and timescales;
- Uncertainty about the results of behaviour change interventions;
Figure 9 shows the relative frequency of words provided to explain these additional barriers to tackling climate change.
Figure 9. To what extent or not are the following factors a barrier to your authority tackling climate change? Legislation and regulation (please specify).
Climate change support offered by the LGA
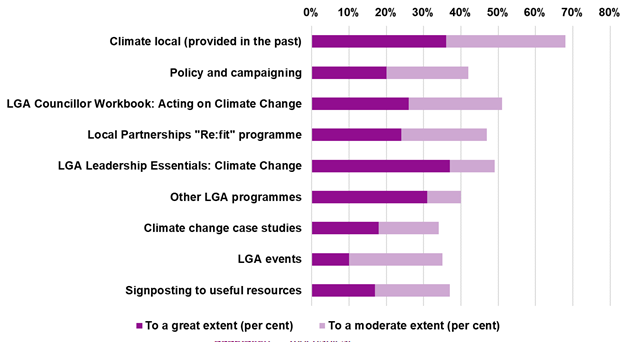
The LGA established its improvement offer for climate change in February 2020, shortly before the survey was deployed. Although some aspects of the offer existed prior to this point, this was the first time that the LGA offered an integrated package of solutions in this area. To establish an initial baseline for awareness of the various aspects of this offer, respondents were asked the extent to which they were aware of a variety of forms of support around climate change that the LGA or its partners provided at the time of the survey or before. As Table 29 and Figure 10 show, the form of support which respondents showed the highest awareness of was the previously offered Climate local programme, a historic offer which had previously been offered before the introduction of the integrated improvement offer, followed by the LGA Councillor Workbook and Leadership Essentials programmes focusing on climate change. This was followed by the “Re:fit” programme offered by Local Partnerships, and the LGA’s policy and campaigning work.
Figure 10. To what extent or not are you aware of the following forms of support around climate change that the LGA provides or has provided?
| To a great extent (per cent) | To a moderate extent (per cent) | To a small extent (per cent) | Not at all (per cent) | Base (all respondents who answered the question) | |
|---|---|---|---|---|---|
| Climate local (provided in the past) | 36% | 32% | 21% | 13% | 92 |
| Policy and campaigning | 20% | 22% | 42% | 16% | 92 |
| LGA Councillor Workbook: Acting on Climate Change | 26% | 25% | 33% | 16% | 92 |
| Local Partnerships "Re:fit" programme | 24% | 23% | 27% | 26% | 92 |
| LGA Leadership Essentials: Climate Change | 37% | 12% | 29% | 22% | 92 |
| Other LGA programmes (behavioural change, design in the public sector, etc) | 31% | 9% | 29% | 32% | 91 |
| Climate change case studies | 18% | 16% | 26% | 39% | 92 |
| LGA events (conferences on climate change, energy, electric vehicles, waste, etc) | 10% | 25% | 37% | 28% | 92 |
| Signposting to useful resources | 17% | 20% | 29% | 34% | 92 |
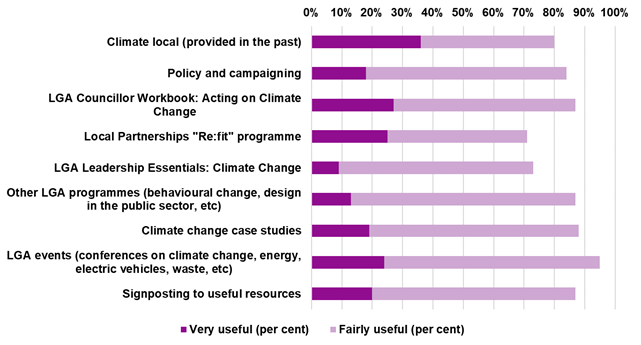
Respondents were asked to rate those forms of support offered by the LGA and its partners that they had indicated at least some form of awareness of based on how useful or not their authority had found them. If their authority had not used a specific form of support, the respondent was asked not to rate the usefulness of that form of support. As Table 30 and Figure 11 show, the forms of LGA support which respondents found most useful were LGA events, climate change case studies, other LGA programmes, signposting to useful resources and the LGA Councillor Workbook: Acting on Climate Change.
Figure 10. How useful or not has your authority found those forms of support around climate change offered by the LGA?
| Very useful (per cent) | Fairly useful (per cent) | Not very useful (per cent) | Not at all useful (per cent) | Base (all respondents who answered the question) | |
|---|---|---|---|---|---|
| Climate local (provided in the past) | 36% | 44% | 21% | 0% | 39 |
| Policy and campaigning | 18% | 66% | 13% | 3% | 38 |
| LGA Councillor Workbook: Acting on Climate Change | 27% | 60% | 10% | 3% | 30 |
| Local Partnerships "Re:fit" programme | 25% | 46% | 21% | 8% | 24 |
| LGA Leadership Essentials: Climate Change | 9% | 64% | 27% | 0% | 22 |
| Other LGA programmes (behavioural change, design in the public sector, etc) | 13% | 74% | 13% | 0% | 23 |
| Climate change case studies | 19% | 69% | 11% | 0% | 36 |
| LGA events (conferences on climate change, energy, electric vehicles, waste, etc) | 24% | 71% | 4% | 0% | 45 |
| Signposting to useful resources | 20% | 67% | 11% | 2% | 45 |
Respondents were asked in what ways the LGA could support their authority in carrying out climate change activity. As Table 31 and Figure 12 show, the most frequently mentioned forms of support were lobbying for change around funding (92 per cent), lobbying for change in legislation (81 per cent), sector specific good practice guidance on scope 3 benchmarking (77 per cent), good practice and case studies (76 per cent) and climate change workshops and events (70 per cent).
Figure 12. In what ways, if any, could the LGA support your authority in carrying out climate change activity?
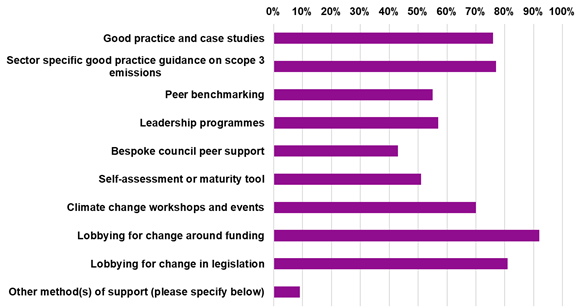
Table 31: In what ways, if any, could the LGA support your authority in carrying out climate change activity?
| Per cent | |
|---|---|
| Good practice and case studies | 76% |
| Sector specific good practice guidance on scope 3 emissions | 77% |
| Peer benchmarking | 55% |
| Leadership programmes | 57% |
| Bespoke council peer support | 43% |
| Self-assessment or maturity tool | 51% |
| Climate change workshops and events | 70% |
| Lobbying for change around funding | 92% |
| Lobbying for change in legislation | 81% |
| Other method(s) of support (please specify below) | 9% |
| None of the above | 0% |
| Don't know | 0% |
Base: all respondents who answered the question (88 respondents).
Respondents who identified other means of support were asked to specify what form of support the LGA could offer in an open text box. Seven responses were given, which were as follows:
- “Assistance with multi-stakeholder coordination”;
- “Bring back Climate Local!”;
- “Common performance framework”;
- “Helping to get more consistency in the approach of different local authorities, e.g. if everyone had the same strict planning policies it would be better than if only one does”;
- “Linking rural councils, particularly around adoption of local plans with ambitious climate agenda”;
- “Role of non-state finance for investment, lending, crowdfunding or commercial collective action interventions”;
- “Shared resources and funding”.
Policy areas which the LGA needs to focus on in the next five years
Respondents were asked to identify the policy areas relevant to their authority which they thought the LGA needed to focus on in the following five years. They were presented with a series of open text boxes to identify these policy areas. Each text box focused on a different sector or service area:
- Transport;
- Waste;
- Housing and planning;
- Energy;
- Contingency plans;
- Countryside protection;
- Nature and biodiversity;
- Other policy areas.
Transport
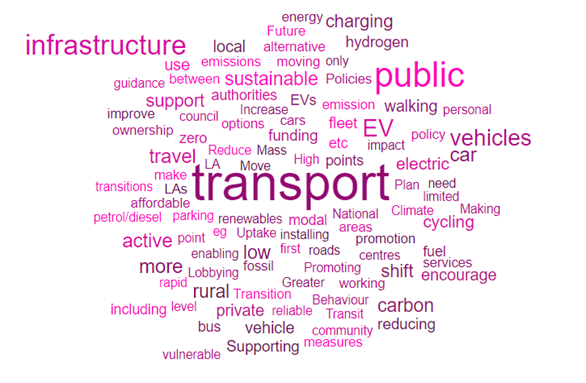
In total, 55 respondents provided policy areas for transport. These areas can be grouped into the following categories:
- Policies supporting an increase in capacity and promotion of the use of public transport infrastructure, including better integrating this infrastructure across the country, potentially requiring an increase in transport subsidies (26 respondents);
- Policies promoting the use of electric vehicles and the establishment of the required infrastructure to support them, especially ensuring the interoperability of infrastructure such as charging stations and clarifying any constraints that exist with regard to the establishment of such infrastructure (22 respondents);
- Policies promoting active travel, such as walking and cycling (eight respondents);
- Policies focusing on supporting sustainable transport in rural, more isolated areas, identified by respondents as finding the establishment of such transport particularly difficult (eight respondents);
- Policies establishing low traffic neighbourhoods and requiring restrictions on the creation of further car infrastructure such as car parks, ultimately banning combustion vehicles sooner than current targets (four respondents);
- Policies assisting councils to transition to a zero carbon, fleet, particularly focusing on larger vehicles such as gritters and dustbin lorries (four respondents);
- Policies establishing a hydrogen-based infrastructure (three respondents);
- Policies devolving more powers to local areas with relation to sustainable transport (two respondents);
- Policies reimbursing local authorities for the additional costs involved in ensuring sustainable transportation (two respondents);
- A collection of policy areas which were suggested by one respondent each:
- Air quality standards;
- Amending current transport scheme appraisal tools to ensure the criteria prioritise positive climate emergency outcomes, such as walking, cycling and bus priority measures;
- Certainty on viability of alternative energy sources;
- Clarity in policy requirements and targets;
- Ensuring the resilience of the transport network;
- Improving mechanisms and incentives for the rapid uptake of Ultra Low Emission Vehicles;
- Improve the efficiency/reduce emissions of freight vehicles travelling between local authorities;
- Incentives for vehicle companies to move away from petrol and diesel;
- Increased development of renewable power infrastructure;
- Policies to encourage cyclical electricity use. For example, electric vehicle chargers to not only discharge in to vehicles but to also allow excess battery stored energy to be fed back in to the grid;
- Promoting working at home;
- Provision of community transport for adults services so adults receiving care can travel together, reducing solo transportation;
- Reviewing the impact of the UK's international aviation and shipping emissions;
- Road redesign policy and guidance.
Figure 13 shows the relative frequency of words provided in relation to policy areas in the transport sector which the LGA should focus on for the next five years.
Figure 13. What are the policy areas relevant to your authority which you think that the LGA needs to focus on in the next five years? Transport
Waste
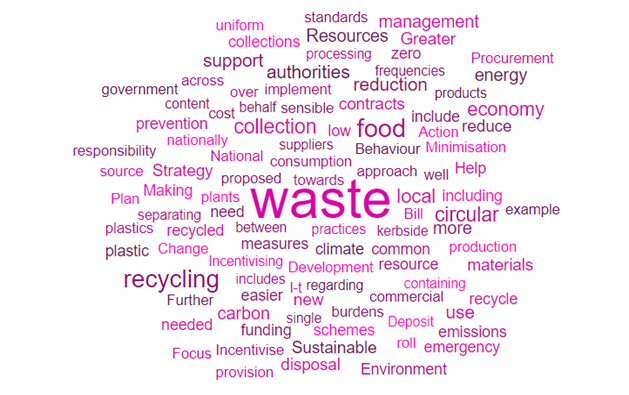
In total, 51 respondents provided policy areas for waste. These areas can be grouped into the following categories:
- Policies further establishing an effective household waste recycling system (14 respondents);
- Policies providing guidance and incentives towards a zero waste or circular economy (10 respondents);
- Policies confirming whether collecting food waste is worthwhile, and supporting these collections if so (nine respondents);
- Policies integrating and standardising recycling systems nationwide, with clearer standards for what can and should be recycled (six respondents);
- Policies encouraging energy from waste (four respondents);
- Policies encouraging reduction of waste at source, with suppliers, and ensuring their greater financial responsibility for its disposal (three respondents);
- Policies devolving local powers with regard to waste (two respondents);
- Policies providing incentives for sustainable materials and packaging (two respondents);
- Policies providing incentives to make it commercially viable for businesses to separate their recyclable and non-recyclable commercial waste (two respondents);
- Policies incentivising a reduction in the use of plastics (two respondents);
- Policies providing more funding for waste prevention (two respondents);
- Policies providing support for the roll out of proposed uniform collections in the Environment Bill, and accounting for the funding burden face by authorities with long term contacts that don’t include food waste (two respondents);
- A collection of policy areas which were suggested by one respondent each:
- Clearer guidance from DEFRA regarding kerbside collection frequencies
- Ensure the Government's new Resources and Waste Strategy fully supports the need to address the climate emergency and provides local authorities with the powers and resources needed to increase recycling targets, food and garden waste management and additional measures to reduce the environmental impact of resource use and the creation of waste.
- Fly-tipping enforcement powers
- Further support for small-scale processing of recyclable materials
- Incentives for deposit return schemes
- Increased control of where and how recycling is processed, to ensure it is truly recycled
- Information on the carbon impact of recycling
- Infrastructure and resources for hard to recycle waste streams
- Update to the National Waste Plan, NPPW and new legislation as a result of the waste and resources strategy
Figure 14 shows the relative frequency of words provided in relation to policy areas in the waste sector which the LGA should focus on for the next five years.
Figure 14. What are the policy areas relevant to your authority which you think that the LGA needs to focus on in the next five years? Waste
Housing and planning
In total, 51 respondents provided policy areas for housing and planning. These areas can be grouped into the following categories:
- Policies granting improved powers for local authorities to impose energy efficiency, zero carbon, PassivHaus or equivalent standards, to ensure older design standards are not still being implemented, and to reward compliant developers and be supported in dealing with complaints from developers dissatisfied with any tightening of standards (38 respondents);
- Policies granting local authorities funding for major retrofit projects for energy efficiency (18 respondents);
- Ensuring the Future Homes Standard is fit for purpose and will enable buildings to be carbon neutral, and bringing forward its targets (five respondents);
- Updating and improving the National Planning Policy Framework (NPPF) and associated guidance for planning inspectors, to ensure future development plan documents recognise the importance of tackling climate change (five respondents);
- Policies supporting the inclusion of renewable energy in housing projects (five respondents);
- Policies supporting the transition from gas to electric heating (four respondents);
- Policies ensuring co-ordinated nationwide action and shared building and planning standards (two respondents);
- Policies ensuring that new planning and housing requirements do not disincentivise developers (two respondents);
- Policies making energy efficiency funding streams from the Energy Companies Obligation (ECO) available for local authorities to manage (two respondents);
- Planning rules to ensure houses are equipped to cope with overheating, flooding, and other potential adverse climate change effects (two respondents);
- Policies supporting “15 minute neighbourhoods” with amenities a short distance away from homes, to reduce transport requirements (two respondents);
- Policies supporting the development of a skilled workforce for retrofit and renewable technologies (two respondents);
- A collection of policy areas which were suggested by one respondent each:
- Ensuring energy efficiency in existing buildings is a national infrastructure priority, targeting support at the fuel poor;
- Helping ensure low carbon development policies get past an inspector
- Making changes in planning regulations to allow councils who have made declarations on climate emergency to be able to fast-track reviews of their local plans to accommodate new climate emergency policies.
- National approaches for "listed buildings"
- Furthering powers to discourage development on significant habitats and vulnerable areas
- Reduced emphasis on "meeting the housing need at all costs"
- Requiring a planning application to be submitted for cooling devices.
- Support for eco self-builds
- Support to planning teams for low carbon housing developments
- Longer term development commitments for greater accountability
Figure 15 shows the relative frequency of words provided in relation to policy areas in the housing and planning sector which the LGA should focus on for the next five years.
Figure 15. What are the policy areas relevant to your authority which you think that the LGA needs to focus on in the next five years? Housing and planning
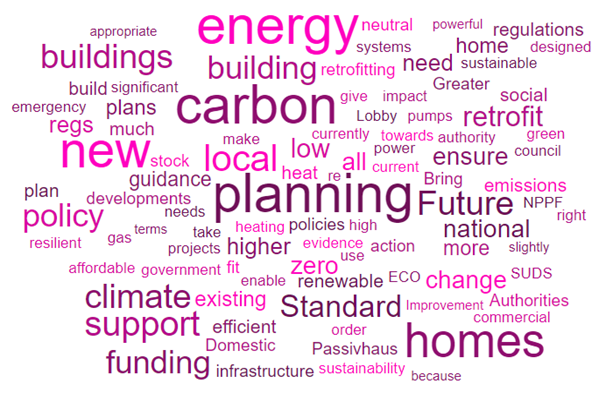
Energy
In total, 50 respondents provided policy areas for energy. These areas can be grouped into the following categories:
- Policies moving the entire national grid to wholly renewable energy (21 respondents);
- Policies supporting community and localised energy projects, including those run by local authorities (11 respondents);
- Policies ensuring transparency with network suppliers in disclosing grid capacities, and helping to improve this capacity (six respondents);
- Policies reintroducing solar feed-in tariffs and the maintenance and expansion of renewable heat incentives (five respondents);
- Policies establishing and supporting district heating systems (three respondents);
- Policies assisting and incentivising energy networks to decarbonise their heating provision (three respondents);
- Policies supporting the introduction of commercial and domestic batteries to store and redistribute energy (two respondents);
- A collection of policy areas which were suggested by one respondent each:
- Supporting council capacity for relevant data collection and analysis
- Support with difficulties installing renewable energy plants in military areas
- Free advice for local authorities on renewable energy investment opportunities
- Funding for those in fuel poverty to improve energy efficiency
- Particular support for energising non-urban areas
- “Pay as you save” market reignition
- Relaxation of planning restrictions on wind and solar
- Sector-wide partnership on energy generation
- Setting ambitious new targets for the deployment of new renewable power generation and for the removal of VAT on solar and battery storage technologies
- Support for community energy projects
- Support for hydrogen power
- Supporting schools to decarbonise
Figure 16 shows the relative frequency of words provided in relation to policy areas in the energy sector which the LGA should focus on for the next five years.
Figure 16. What are the policy areas relevant to your authority which you think that the LGA needs to focus on in the next five years? Energy
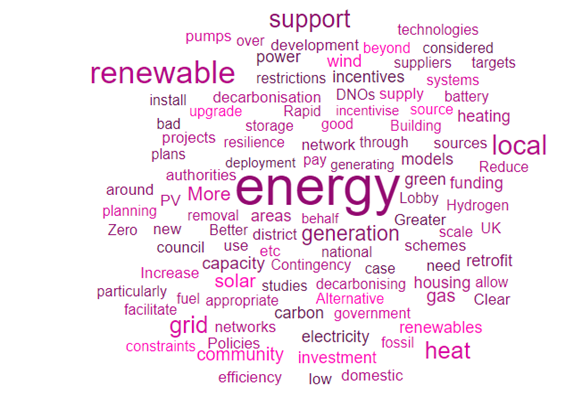
Contingency plans
In total, 26 respondents provided policy areas for contingency plans. These areas can be grouped into the following categories:
- Policies supporting prediction of, and adaptation to, flooding (nine respondents);
- Policies supporting prediction of, and adaptation to, overheating (five respondents);
- Policies providing a supportive framework for effective adaptation plans for a range of circumstances (five respondents);
- Policies enhancing the long-term future modelling and overall prediction and understanding of the implications of climate change for local areas (three respondents);
- The introduction of a requirement for councils to include environmental disasters in risk assessments (two respondents);
- A collection of policy areas which were suggested by one respondent each:
- Clear nationwide recognition and support for severe weather events and compensating affected local authorities
- Embedding climate change into resilience work
- Support and guidance on other issues than flooding
- Support coping with the public health impact of climate change
Figure 17 shows the relative frequency of words provided in relation to policy areas relating to contingency plans which the LGA should focus on for the next five years.
Figure 17. What are the policy areas relevant to your authority which you think that the LGA needs to focus on in the next five years? Contingency plans
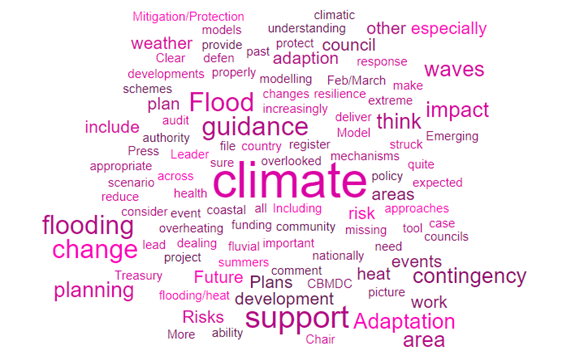
Countryside protection
In total, 20 respondents provided policy areas for countryside protection. These areas can be grouped into the following categories:
- Policies including consideration and support for the role of the countryside in carbon sequestration and combating urban heat islands, with enhanced priority given to tree planting and re-wilding (five respondents);
- Policies redesigning agricultural subsidies following Brexit to maximise the environmental incentives provided (three respondents);
- Policies supporting the restoration and protection of the countryside in genral (three respondents);
- Policies enabling a balance between the protection of nature and its use for public enjoyment and renewable energy (two respondents);
- A collection of policy areas which were suggested by one respondent each:
- Combining environmental protection with improving rural health and wellbeing
- Ensuring the smooth transition of EU conventions on landscape protection into UK law
- Understanding and measuring the carbon impact of agriculture
Figure 18 shows the relative frequency of words provided in relation to policy areas relating to countryside protection which the LGA should focus on for the next five years.
Figure 18. What are the policy areas relevant to your authority which you think that the LGA needs to focus on in the next five years? Countryside protection
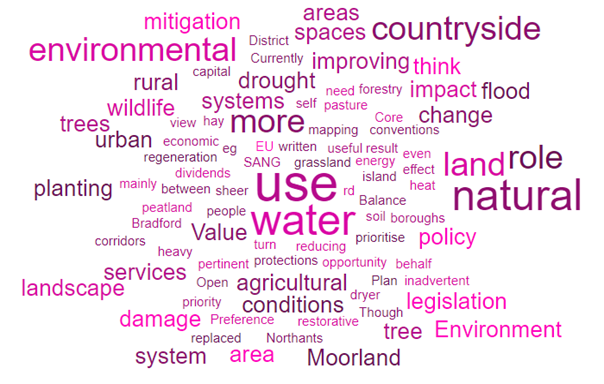
Nature and biodiversity
In total, 33 respondents provided policy areas for nature and biodiversity. These areas can be grouped into the following categories:
- Policies supporting biodiversity net gains (seven respondents);
- Policies supporting and incentivizing tree planting (six respondents);
- Policies supporting the development of blue-green infrastructure (two respondents);
- Policies providing funding for the creation of biodiversity-nurturing habitats (two respondents);
- Policies providing guidance on analysing data for biodiversity and other environmental factors in tandem (two respondents);
- Policies supporting and incentivizing procurement practices which avoid purchasing products creating worldwide diversity loss (two respondents);
- A collection of policy areas which were suggested by one respondent each:
- Ensuring a balance between biodiversity and land use
- Clarification and case studies of relevant legislation
- Consideration of both rural and urban biodiversity
- Guidance on managing the biodiversity impact of roads, domestic cats and dog walking sites.
- Higher Nature Stewardship arrangements or similar - enabling and providing capacity for these to continue
- Incentivising and supporting people to improve their own gardens
- A nationally agreed species protection list
- Powers, support and guidance for dealing with soil and water management
- Prioritising nature and biodiversity over buildings
- Redesigning agricultural subsidies to incentivise protecting biodiversity
- Support in woodlands management and the expansion of new forests
Figure 19 shows the relative frequency of words provided in relation to policy areas relating to nature and biodiversity which the LGA should focus on for the next five years.
Figure 19. What are the policy areas relevant to your authority which you think that the LGA needs to focus on in the next five years? Nature and biodiversity
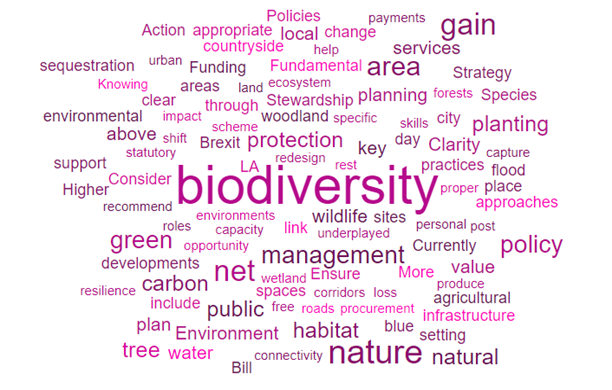
Other policy areas
In total, 16 respondents provided policy areas for other policy areas. These areas can be grouped into the following categories:
- General support, encouragement and sharing of innovative approaches to dealing with climate change (two respondents);
- Support for projects by local authorities which establish a precedent and enlarge the boundaries of what local government is capable of in combatting climate change (two respondents);
- A collection of policy areas which were suggested by one respondent each:
- Carbon tax
- Climate education and carbon literacy training
- Green recovery following COVID-19
- Improved air quality
- Policies to reduce vandalism of newly constructed habitats through public engagement
- Regulations and incentives for business emissions reduction
- Sustainable food, including community growing, local food networks
- A need to 'embed' actions across all areas of government (national, regional and local), recognising the importance of climate emergency action in order to ensure policies/services are appropriately designed.
Figure 20 shows the relative frequency of words provided in relation to policy areas relating to other policy areas which the LGA should focus on for the next five years.
Figure 20. What are the policy areas relevant to your authority which you think that the LGA needs to focus on in the next five years? Other policy areas
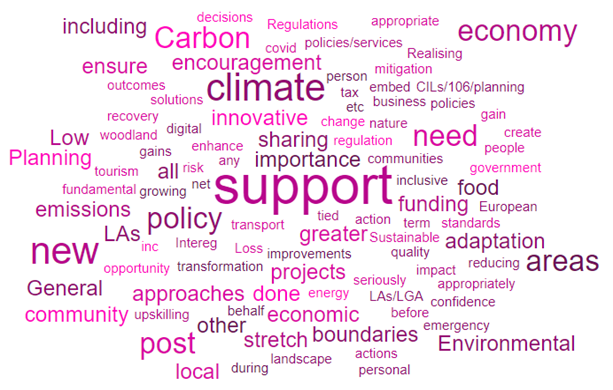
Sharing of interesting or notable actions in relation to climate change
The survey concluded by asking respondents in another open text box whether their council had done anything interesting or notable in relation to climate change that they would like to share with other authorities. In total 34 respondents provided text in response to this question. Their actions could be grouped into the following categories:
- Energy (14 respondents): one council reported installing heat pumps in four council housing tower blocks, saving 170 families 50% on their annual heating bills;
- Public engagement (eight respondents); several respondents mentioned projects done to raise awareness of climate change issues among the public, particularly among young people and in schools;
- Emissions (six respondents); one respondent mentioned reducing corporate carbon dioxide emissions by 70 per cent in 2018/19 compared to 2006/07, exceeding their 2020/21 target by 10 per cent and two years early;
- Biodiversity (five respondents); several respondents mentioned work in woodlands and green spaces, riversides and large scale green infrastructure projects;
- Housing (five respondents); one respondent mentioned over 700 private homes in a wide variety of locations being given solid wall insulation as a result of a council-run project;
- Transport (five respondents); respondents mentioned projects such as electric car clubs, on-street electric charging points and mass transit systems;
- Assessment and research (three respondents); respondents mentioned studies, risk assessments and impact assessments to help inform the future position of their local authorities;
- Charters and targets (three respondents); respondents mentioned agreements, targets and charters among both council staff and elected members and the general public;
- Collaboration and partnership (two respondents); one respondent mentioned developing partnership through a multi-organisational group bringing diverse stakeholders together to achieve a net zero emissions position for their locality;
- Education and training (two respondents); one respondent reported launching a microsite dedicated to climate change to raise awareness of relevant issues among their residents;
- Flood adaptation (two respondents); one respondent mentioned a newly completed wetland system providing large-scale flood storage during extreme weather events and protecting 140 properties from flooding;
- Food projects (one respondent); the respondent mentioned establishing and leading in community sustainable food projects based locally;
- New roles (one respondent); the respondent mentioned establishing a new role within the authority to lead on all matters relating to climate change.
Annex A: Questionnaire
Please find the downloadable word document:
Annex A: Questionnaire (Word Document)