How the data has been interpreted
The data that has informed our analysis is taken from the UK Government records on the 2014-2020 European Structural Investment Funds (ESIF) England programme only. The beneficiaries data in this project reflects the position up to October 2020. ESIF funding will continue to be spent until 2023. This project is therefore a snapshot of how much had been received from the beginning of the programme up to October 2020 and will not reflect the final programme total.
The data used in this project is publicly available on the UK Government website. As the programme has not been fully completed, the data differs from the EU website due to reporting differences. The UK Government data has therefore been used because it provides greater geographical and thematic detail.
Several projects have a crossover between England and Wales, the location data on these projects has been updated to correspond with the England-based LEP.
The ESIF Programme is a ‘shared management’ programme with the EU and the UK Government.
The UK Government is responsible for negotiating funding distribution across the devolved administrations, and managing the UK’s participation and spend.
For England, Department for Levelling Up, Housing and Communities (DLUHC) and Department for Work and Pesions (DWP) act as the managing authority.
It is not possible to identify the exact exchange rate on every funded project, so a single exchange rate per year has been applied:
| Year | Euro to Pound exchange rate |
|---|---|
| 2014 | 1 = 0.8364 |
| 2015 | 1 = 0.7823 |
| 2016 | 1 = 0.73799 |
| 2017 | 1 = 0.853 |
| 2018 | 1 = 0.888768 |
| 2019 | 1 = 0.90273 |
| 2020 | 1 = 0.85208 |
| 2021 | 1 = 0.90307 |
A comparison of ESIF versus UKSPF
ESIF funding distribution
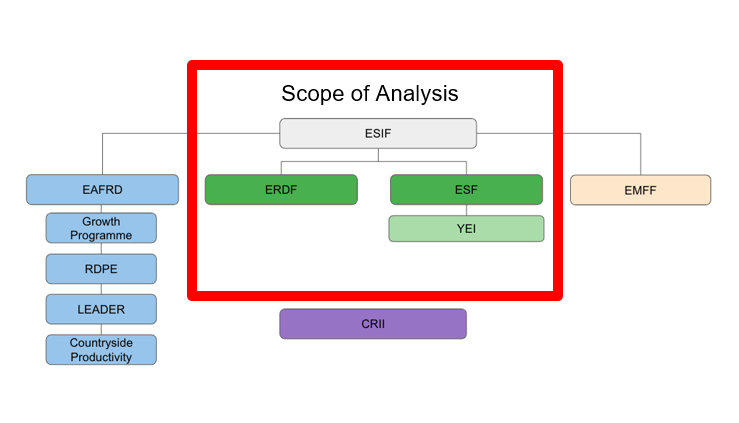
The analysis in our research focuses on the England European Regional Development Fund (ERDF) and European Structural Fund (ESF) programmes and includes the Youth Employment Initiative (YEI).
Due to lack of available data we have not been able to include detailed analysis of the European Agricultural Fund for Rural Development (EAFRD) and European Maritime and Fisheries Fund (EMFF) programmes.
Use of ‘the ESIF programme’ in the analysis is used to explain the findings under both ERDF and ESF together. This is also known as the ‘England Growth Programme’.
The ESIF Programme is a shared management programme with the EU and the UK Government is responsible for managing the UK’s participation in the 2014-20 programme. The UK Government negotiated funding distribution across the devolved administrations.
In England, DLUHC and DWP are the managing authorities and directed funding to Local Enterprise Partnership areas (“LEP areas”) and some combined authorities to deliver projects on social, economic and environmental priorities.
Quantum
ESIF headline figures
ESIF
Under the ESIF programme England received just under £7.7 billion in funding in the 2014-2020 period. Funding under the ESIF programme was a combination of investment from the EU and match funding from the UK government and private sources. The total EU investment received up to October 2020 is just over £3.9 billion. The total England match funding generated up to October 2020 is just under £3.8 billion.
Breakdown
The ESIF budget was allocated between the ERDF and ESF programmes.
Quantum of funding
In 2014 England was provisionally allocated €6,937.2 million (£5.3 billion) (at 2014 prices) of EU funding for the 2014-20 ESIF Programme.
As of October 2020
- Just over £3.9 billion was funded via EU funding
- Just under £3.8 billion was funded via domestic match funding
- Total spent was just under £7.7 billion (including match funding)
The average per year (over the seven year period):
- £628,296,632.17 of domestic match funding
- £652,494,904.83 of EU funding
Side-by-side
This chart compares the total funding received by October 2020 under ESIF in England compared to the proposed funding allocation under the UK wide SPF is more.
The complementary domestic funds will operate alongside the UK Shared Prosperity Fund (UKSPF) to help support the Government’s levelling up agenda. These programmes are allocated by competitive bidding processes and will run over a period of up to five years. The length of the UKSPF programme is yet to be determined.
| ESIF Programme up to October 2020 (England only) | UKSPF (UK wide) |
|---|---|
| Match + EU funding (England) Total: just under £7.7bn Annual: just over £1.2bn |
UKSPF funding (UK wide) £2.6bn in total up to 2024/25 |
| Match funding only (England) Total: just over £3.9bn Annual: just over £628m |
Examples of complementary domestic funds (2021-2025): £4.8bn Levelling Up £3.6bn Towns Fund £7.1bn National Home Building Fund Freeports |
More information on the latest figures can be found on the GOV.UK website.
Mapping council funding
In the resources provided we have created a map of council projects across England.
Key
Strategic priorities
ERDF priority breakdown
European Regional Development Fund (ERDF) allocations must meet at least one of the nine thematic areas (referred to as "priority axis") under the programme.
| Thematic areas | Priority axis for the ERDF |
|---|---|
| Research and innovation | Priority 1: Research and innovation |
| IT and broadband | Priority 2: Enhancing access to, and use and quality of, ICT |
| Business support | Priority 3: Enhancing the competitiveness of SMEs |
| Low carbon | Priority 4: Supporting the shift towards a low carbon economy in all sectors |
| Climate change | Priority 5: Promoting climate change adaption, risk prevention and management |
| Environment | Priority 6: Preserving and protecting the environment and promoting resource efficiency |
| Transport | Priority 7: Sustainable transport in Cornwall and the Isles of Scilly |
| Social inclusion | Priority 8: Promoting social inclusion and combating poverty and any discrimination |
| Technical assistance | Priority 9: Technical assistance |
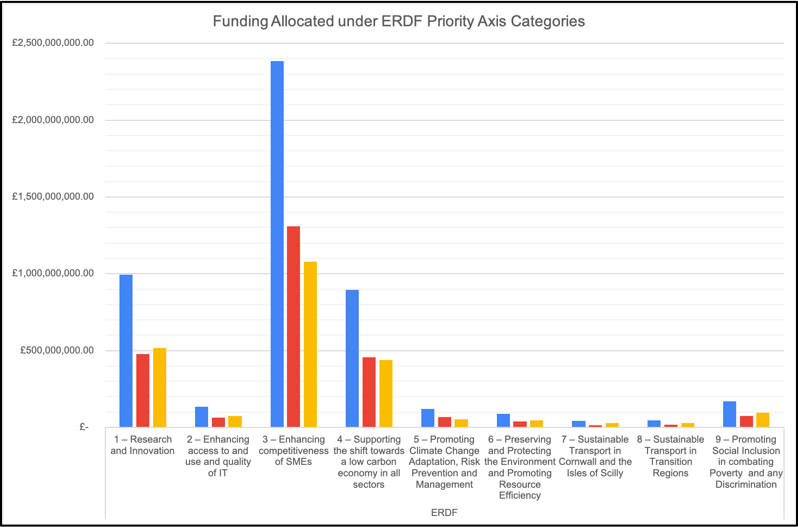
ERDF thematic allocations
The priority axis that received the largest investment in England was enhancing the competitiveness of SMEs.
As of October 2020, PA3 has received so far £2.3 billion from programme budget.
The largest regional recipients under PA3 were the North West (£604 million), West Midlands (497 million) and North East (£311 million)
The graph shows the funding received under each priority axis ranked from highest value.
ESF priority breakdown
European Social Fund (ESF) allocations must meet one of the three thematic areas (referred to as “priority axis”) under the programme.
| Thematic areas | Priority axis for the ESF |
|---|---|
| Access to employment | Priority 1: Inclusive labour markets |
| Learning and skills | Priority 2: Skills for growth |
| Technical assistance | Priority 3: Technical assistance |
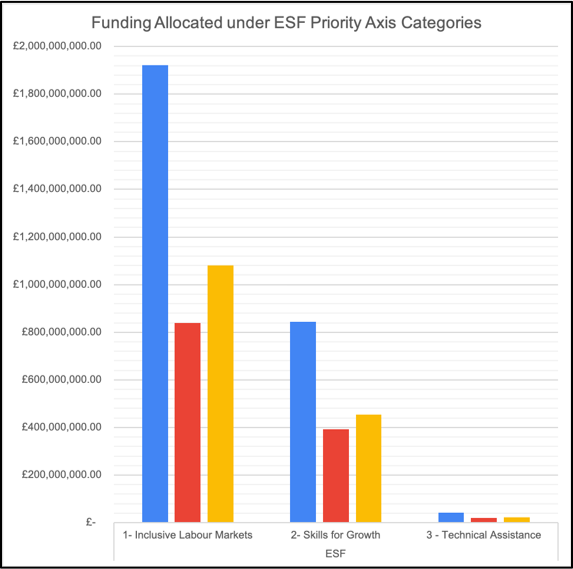
ESF thematic allocations
The priority axis that received the largest investment in England was inclusive labour markets.
As of October 2020, PA1 received £1.9 billion, or 68 per cent of the programme budget.
The largest regional recipients under PA1 were the London (£283 million), North West (£302 million) and West Midlands (£323 million).
The graph shows the funding received under each priority axis ranked from highest value.
Wider growth funding context
The Levelling Up Agenda
In addition to funding under the UKSPF, Government has announced a package of other funds that will also benefit local areas, including:
| Levelling Up Fund |
● Focus: Local infrastructure. This includes bypasses and other local road schemes, bus lanes, railway station upgrades, regenerating eyesores, upgrading town centres and community infrastructure, and local arts and culture.
● Value committed: £4.8 billion
● Term: four years, starting 2021
● Scope: UK wide
● Process: Bidding
|
|---|---|
| Towns Fund |
● Focus: Investment in towns. Long term economic and productivity growth through investment in connectivity, land use, economic assets including cultural assets, skills and enterprise infrastructure.
● Value committed: £3.6 billion
●Term: five years, starting 2021
● Scope: England
● Process: Bidding
|
| National Home Building Fund |
● Focus: Building more affordable, sustainable homes across England.
● Value committed: £7.1 billion
● Term: four years, starting 2021
● Scope: England
|
UK Shared Prosperity Fund Head of Terms
Scope of work
To understand how the transition to UKSPF will affect the investment into strategic priorities, it is beneficial to compare the programmes side-by-side.
In our analysis, we have identified there is relative consistency between the thematic focus of the old programme and the new programme.
The main differences are: