Executive Summary
In this report, we set out the key mechanisms in place at both national and local level to support economically vulnerable households through the COVID-19 crisis. We then present modelling results of potential impacts of the removal of these support mechanisms.
National support mechanisms
At national level, key support mechanisms are as follows:
- Policies to support the incomes of those in employment, namely the Coronavirus Job Retention Scheme (commonly called the furlough scheme) and the Self-employment Income Support Scheme (SEISS).
- Universal Credit, which provides a financial safety net for those who have no income or low incomes. In response to the crisis, the government uplifted the standard allowance and the Local Housing Allowance and relaxed the assessment rules for self-employed people.
- Payment holidays on debt, namely mortgage payment holidays and payment holidays on loans and credit cards.
- A temporary ban on the eviction of renters.
- Other national support measures, such as the option to defer self-assessment payment on account and a pilot of a no-interest loans scheme.
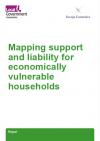
The figure below shows the announced end dates of these various support mechanisms.
Figure 0.1: Planned timeline for withdrawal of COVID-19 support policies
Local support mechanisms
Local authorities have also been at the forefront of providing support to economically vulnerable households through the crisis. While the support by councils has varied, responses by a number of councils to an LGA survey suggest that councils have supported economically vulnerable households in the following ways:
- assisted households struggling to pay council tax bills. This has been done through pre-existing Council Tax Reduction Schemes, additional council tax relief funded by the government’s COVID-19 hardship fund, the provision of alternative payment arrangements, and lighter touch approaches to enforcement.
- assisted households with housing needs. Councils typically appear to have spent more providing temporary accommodation for homeless people, as well as spending more on Discretionary Housing Payments to assist residents struggling to pay their rent.
- assisted households with a range of other needs. This has included providing greater support through Local Welfare Assistance schemes, the provision of food and other essentials from the funding provided by the government’s Emergency Assistance Grant for Food and Essential Supplies, enhanced support through the winter from funding under the COVID Winter Grant Scheme, and the provision of a greater number of free school meals. Councils may also be providing greater support in the areas of debt advice, support with mental health, and assistance with job finding or training for new roles.
Regional unemployment projections
To understand the potential impact on unemployment in different regions when the furlough scheme comes to an end on 30 September 2021, we considered three COVID-19 scenarios. In our short scenario, the vaccination programme is a success and there is limited economic scarring. In our medium scenario, the vaccination programme is also successful, but there is a greater degree of economic scarring from the crisis. In our extended scenario, there is another lockdown towards the end of 2021 (e.g. due to a new coronavirus variant), leading to another drop in economic output and greater economic scarring thereafter.
The main findings from our scenario modelling are:
- The UK unemployment rate immediately after the furlough scheme ends at the end of September 2021 could range between 5.1 and 6.8 per cent.
- In the event that there is a third wave of infections in Autumn 2021 (e.g. due to a new strain of the virus) and a subsequent lockdown, the unemployment rate could rise – without the resumption of the furlough scheme and absent any other support measures – to nearly 15 per cent.
- Depending on the extent of economic scarring caused by over a year of below-trend economic output, the unemployment rate could return to the pre-pandemic level either by the beginning of 2022 or in several years’ time.
- The modelled unemployment rate in our central (medium) scenario is slightly more optimistic than the recent projections of the OBR and the Bank of England.
- The projected unemployment in our scenarios varies by region, with the highest unemployment rate once the furlough scheme ends being in the North East.
Impact on Finances of Stylised Economically Vulnerable Households
We modelled the potential impact of selected support mechanisms on the finances of economically vulnerable households. The support mechanisms we considered were Universal Credit (including the uplift to standard allowances), Discretionary Housing Payments, support with food expenditure from the Winter Grant Scheme, and zero-interest loans. We considered the impact on stylised households with low, medium and high financial resilience, in each case considering stylised one-parent and two-parent households. We took account of regional variations in household expenditure and LHA rates in our modelling.
Key findings from this modelling are as follows:
- During the period in which the £20 per week uplift to the UC standard allowance is in place, the majority of our stylised households are able to meet their monthly expenditure. However, the end of this uplift causes financial difficulties for some of our stylised households.
- Our stylised households are more likely to get into debt in parts of the country where the cost of living is higher, given that the UC standard allowance and the additional UC amount for children are the same nationwide. Further, the government’s Benefit Cap may cause financial difficulties for stylised households in areas where rental costs are higher.
- Economically vulnerable households which start off with significant debt are at risk of entering a debt spiral, where debt increases to unsustainable levels due to the household’s inability to pay the interest on their debt.
- A zero interest loans scheme may slow down the accumulation of debt by struggling households, but it does not deal with the underlying problem of household income being insufficient to cover expenditure.
Future research could usefully extend the modelling to consider higher income households which have become newly dependent on UC, households affected by the pandemic which are paying mortgages rather than rent, and households where income earners are on furlough and become unemployed when the furlough scheme ends. The modelling could also be extended to consider households which build up rent arrears rather than taking out other debt.
1. Introduction
Europe Economics was commissioned by the Local Government Association (LGA) to analyse the potential impacts of the withdrawal of COVID-19 support policies on economically vulnerable households. This report presents our analysis.
The methodology employed for the study comprised:
- desk research into COVID-19 support policies
- interviews with a small number of councils, followed by a survey of councils (carried out by the LGA with input from us) to understand the kinds of support being provided at local level
- modelling of the potential impact of the withdrawal of COVID-19 support policies on national and regional unemployment rates; and
- modelling of the finances of some stylised economically vulnerable households as COVID-19 support policies are withdrawn.
Our report is structured as follows:
- section 2 summarises key national support policies
- section 3 draws on responses to the LGA’s survey of councils to present a picture of the kind of support being provided to economically vulnerable households at a local level;
- section 4 presents scenario modelling of how unemployment rates may evolve at national and regional levels;
- section 5 shows how the finances of some stylised vulnerable households may be affected by the withdrawal of support policies
- appendix 1 contains more detailed figures for unemployment projections.
2. Key National Support Measures
The lockdown imposed in the UK has taken a huge toll on the financial wellbeing of households across the UK. Hence, the UK government introduced a range of measures to protect the financial well-being of households during the pandemic.
In this section, we explore the various support measures that have been introduced by the government (or by the Financial Conduct Authority, in the case of payment holidays on debt) and the proposed timeline for withdrawing this support. We consider the following support measures:
- the Coronavirus Job Retention Scheme
- the Self-employment Income Support Scheme (SEISS)
- Universal Credit for those on low incomes or out of work, including the enhanced levels of support being provided during the crisis period
- payment holidays on debt, namely mortgage payment holidays and payment holidays on loans and credit cards
- the ban on evictions
- other national support measures, such as the option to defer self-assessment payment on account; and the pilot of a no-interest loans scheme.
Coronavirus Job Retention Scheme
Description
The Coronavirus Job Retention Scheme (commonly referred to as the furlough scheme) was designed to assist businesses which could not maintain their pre-pandemic workforce because their operations were affected by COVID-19. Simultaneously, introducing the scheme helped individuals who could not do their jobs because of the outbreak, hence preventing mass redundancies. The furlough scheme has been extended a number of times during the COVID-19 crisis.
Under this scheme, businesses can place workers on temporary leave (furlough) and the government pays 80 per cent of their wages, up to a maximum of £2,500 a month. Businesses choose whether or not to top up the wages of furloughed employees.
Changes to the furlough scheme came into effect on 1 July 2020. After this date, the scheme allowed workers to be put on a flexible furlough. Flexible furlough allows workers to work for their employers on a part-time basis, although the workers cannot undertake any work for their employer (or any linked or associated company) during furlough hours. For example, an employer can pay the worker for 2 days during a week and furlough the worker for the other 3 days. Flexible furlough arrangements must be agreed in writing between the employee and the employer before the start of the furlough period.
Cumulative usage of furlough scheme
As of 14 April 2021, 1.3 million businesses have made use of the furlough scheme. A total of 11.5 million jobs have been furloughed and a total value of £61.3 billion paid by the UK government (HRMC coronavirus statistics). In the table below we show how these numbers have increased since the beginning of the scheme in April 2020.
|
Total claims made as of midnight |
Total cumulative number of jobs furloughed (million) |
Total cumulative number of employers furloughing (million) |
Total cumulative value of claims made (£ billion) |
|---|---|---|---|
|
23-Apr 2020 |
3.8 |
0.5 |
4.5 |
|
3-May 2020 |
6.3 |
0.8 |
8.0 |
|
11-May 2020 |
7.5 |
0.9 |
10.1 |
|
17-May 2020 |
8 |
1 |
11.1 |
|
24-May 2020 |
8.4 |
1 |
15 |
|
31-May 2020 |
8.7 |
1.1 |
17.5 |
|
7-Jun 2020 |
8.9 |
1.1 |
19.6 |
|
14-Jun 2020 |
9.1 |
1.1 |
20.8 |
|
21-Jun 2020 |
9.2 |
1.1 |
22.9 |
|
28-Jun 2020 |
9.3 |
1.1 |
25.5 |
|
5-Jul 2020 |
9.4 |
1.1 |
27.4 |
|
12-Jul 2020 |
9.4 |
1.2 |
28.7 |
|
19-Jul 2020 |
9.5 |
1.2 |
29.8 |
|
26-Jul 2020 |
9.5 |
1.2 |
31.7 |
|
2-Aug 2020 |
9.6 |
1.2 |
33.8 |
|
9 Aug 2020 |
9.6 |
1.2 |
34.7 |
|
16 Aug 2020 |
9.6 |
1.2 |
35.4 |
|
20 Sep 2020 |
9.6 |
1.2 |
39.3 |
|
18 Oct 2020 |
9.6 |
1.2 |
41.4 |
|
15 Nov 2020 |
9.6 |
1.2 |
43.0 |
|
13 Dec 2020 |
9.9 |
1.2 |
46.4 |
|
15 Feb 2021* |
11.2 |
1.3 |
53.8 |
|
15 March 2021 |
11.4 |
1.3 |
57.7 |
|
14 April 2021 |
11.5 |
1.3 |
61.3 |
(Caseload figures from 15 February 2021 have an improved methodology and so are not directly comparable with the figures from 2020). Source: HMRC coronavirus (COVID-19) statistics.
Jobs furloughed on 31 March 2021
In Table 2.2, we provide the number of jobs furloughed as of 31 March 2021 and the take-up of the scheme across the different regions of the UK. As of 31 March 2021, a total of 4.2 million employments were furloughed across the UK. London had the highest number of jobs furloughed (654,600), while Northern Ireland had the lowest number of jobs furloughed (99,400) (Source: Coronavirus Job Retention Scheme statistics: 6 May 2021).
|
Region/Country |
Jobs furloughed |
Take-up (%) |
|---|---|---|
|
London |
654,600 |
16 |
|
South East |
566,800 |
14 |
|
North West |
431,900 |
14 |
|
East |
373,700 |
13 |
|
West Midlands |
327,300 |
13 |
|
South West |
345,300 |
14 |
|
Yorkshire and the Humber |
300,300 |
13 |
|
East Midlands |
268,100 |
13 |
|
North East |
138,400 |
13 |
|
Northern Ireland |
99,400 |
13 |
|
Scotland |
327,100 |
14 |
|
Wales |
159,600 |
13 |
|
Unknown |
201,400 |
- |
Source: Coronavirus Job Retention Scheme statistics: May 2021
Phasing out of furlough scheme
During August, September and October 2020, the level of support under the furlough scheme was progressively reduced as part of a plan to phase it out by the end of October 2020. More specifically, from August 2020 onwards, employers became responsible for paying employer NICs and pension contributions for furloughed staff; in September 2020, the government’s contribution to the wages of furloughed staff fell to 70 per cent subject to a cap of £2,187.50, with firms having to pay 10 per cent of wages for these employees subject to a cap of £312.50; and in October 2020, the government’s contribution to the wages of furloughed staff fell to 60 per cent subject to a cap of £1,875, with firms having to pay 20 per cent of the wages of these employees subject to a cap of £625.
However, at the end of October 2020 the government announced that the furlough scheme would be extended, with the level of support available in November 2020 reverting to the original level of 80 per cent of wages up to a maximum of £2,500 a month (albeit with firms responsible for paying paying employer NICs and pension contributions for furloughed staff, in contrast to the original furlough scheme). Further extensions of the scheme followed.
In its March 2021 Budget, the UK government laid out plans to phase out the furlough scheme by 30 September 2020. In Table 2.3, we show the different stages of the phasing out of this scheme.
|
|
June |
July |
August |
September |
|---|---|---|---|---|
|
Government contributions: wages
|
80% up to £2,500 |
70% up to £2,187.50 |
60% up to £1,875 |
60% up to £1,875 |
|
Employer contribution: employer NICs and pension contributions |
Yes |
Yes |
Yes |
Yes |
|
Employer contribution: wages
|
- |
10% up to £312.50 |
20% up to £625 |
20% up to £625 |
|
Employee receives |
80% up to £2,500 |
80% up to £2,500 |
80% up to £2,500 |
80% up to £2,500 |
Source: HM Revenue and Customers: Changes to the Coronavirus Job Retention Scheme.
Self-employment Income Support Scheme
Description
The SEISS was first introduced on 13 May 2020 to support self-employed people to cover some of the losses they faced as businesses struggled due to the pandemic and the subsequent lockdown. The scheme has been extended a number of times with further grants being made available for additional time periods. In the spring 2021 Budget, the UK government announced a fifth and final grant which will run from May to September.
Details of the five SEISS grants are shown in the Table 2.4 below.
|
Grant |
Notional period covered |
Application closing date |
Amount of grant |
Eligibility |
|---|---|---|---|---|
|
1 |
March to 13 July 2020 |
13 July 2020 |
80 per cent of 3 months’ average trading profits (capped at £2,500 per month) |
Self-employed individuals and members of a partnership who:
|
|
2 |
14 July to October 2020 |
19 October 2020 |
70 per cent of 3 months’ average trading profits (capped at £2,190 per month) |
|
|
3 |
November 2020 to January 2021 |
29 January 2021 |
80 per cent of average monthly trading profits (capped at £2,500 per month) |
Self-employed individuals and members of a partnership who were eligible for the first and second grant, who declared that they intend to continue to trade, and who either:
|
|
4 |
February to April 2021 |
1 June 2021 |
80 per cent of 3 months’ average trading profits (capped at £2,500 per month) |
Similar to criteria for third grant, except for requirement to have submitted self-assessment tax return for the tax year 2019/20 by 3 March 2021, with newly self-employed people who started trading in 2019/20 potentially eligible |
|
5 |
May to September 2021 |
To be announced |
80 per cent of 3 months’ average trading profits (capped at £2,500 per month), if turnover in 2020/21 fell by 30 per cent or more; or 30 per cent of 3 months’ average trading profits, capped at £2,850, if turnover in 2020/21 fell by less than 30 per cent |
To be announced |
Take-up of first SEISS grant
Under the first grant, a total of 2,604,000 claims (77 per cent of those eligible to claim) were made across the UK, amounting to £7.6 billion (Self-Employment Income Support Scheme statistics: August 2020). London saw the highest number of claims made (498,000), while the North East saw the lowest number of claims made (72,000). In Table 2.5 we provide the number of claims across the different regions of the UK.
|
Country/Region |
Total no. of claims made to 31/7/20 |
Total value of claims made to 31/7/20 (£m) |
Average value of claims made to 31/7/20(£) |
Proportion of total number of claims made to date (%) |
|---|---|---|---|---|
|
England |
2,251 |
6,577 |
2,900 |
86 |
|
North East |
72 |
189 |
2,600 |
3 |
|
North West |
243 |
642 |
2,600 |
9 |
|
Yorkshire and the Humber |
187 |
506 |
2,700 |
7 |
|
East Midlands |
166 |
477 |
2,900 |
6 |
|
West Midlands |
202 |
565 |
2,800 |
8 |
|
East of England |
266 |
835 |
3,100 |
10 |
|
London |
498 |
1,461 |
2,900 |
19 |
|
South East |
379 |
1,194 |
3,200 |
15 |
|
South West |
239 |
707 |
3,000 |
9 |
|
Wales |
110 |
295 |
2,700 |
4 |
|
Scotland |
157 |
459 |
2,900 |
6 |
|
Northern Ireland |
78 |
223 |
2,900 |
3 |
|
Unknown |
7 |
22 |
3,000 |
0 |
|
United Kingdom |
2,604 |
7,576 |
2,900 |
100 |
Source: Self-Employment Income Support Scheme statistics: August 2020.
The take-up of this scheme across the UK (calculated as the number of claims made to date over the potentially eligible population) was around 77 per cent of the potentially eligible population. Northern Ireland had the highest take-up rate (81 per cent), whereas the South East and South West saw the lowest take up rate (75 per cent). In Table 2.6, we provide the information on the take-up in different regions.
|
Country/Region |
Total potentially eligible population |
Proportion of total eligible population (%) |
Take-Up Rate (%) |
|---|---|---|---|
|
England |
2,946 |
87 |
76 |
|
North East |
94 |
3 |
77 |
|
North West |
312 |
9 |
78 |
|
Yorkshire and the Humber |
241 |
7 |
77 |
|
East Midlands |
218 |
6 |
76 |
|
West Midlands |
263 |
8 |
77 |
|
East of England |
350 |
10 |
76 |
|
London |
648 |
19 |
77 |
|
South East |
502 |
15 |
75 |
|
South West |
318 |
9 |
75 |
|
Wales |
140 |
4 |
78 |
|
Scotland |
208 |
6 |
76 |
|
Northern Ireland |
96 |
3 |
81 |
|
Unknown |
12 |
0 |
59 |
|
United Kingdom |
3,402 |
100 |
77 |
Source: Self-Employment Income Support Scheme statistics: July 2020. Note: Take-up is based on total number of claims to date (excludes error and rejected cases) over total potentially eligible population (includes error and rejected cases).
Take-up of second SEISS grant
Under the second grant, a total of 2,350,000 claims were made across the UK, amounting to £5.9 billion (Self-Employment Income Support Scheme statistics: November 2020). London had the highest number of claims made (465,000), while the North East had the lowest number of claims made (65,000). In Table 2.7, we provide data on the number of claims across the different regions of the UK.
|
Country/Region |
Total no. of claims made to 31/10/20 |
Total value of claims made to 31/10/20 (£m) |
Average value of claims made to 31/10/20(£) |
Proportion of total number of claims made to date (%) |
|---|---|---|---|---|
|
England |
2,034 |
5,148 |
2,500 |
87 |
|
North East |
65 |
149 |
2,300 |
3 |
|
North West |
221 |
507 |
2,300 |
9 |
|
Yorkshire and the Humber |
169 |
395 |
2,300 |
7 |
|
East Midlands |
148 |
369 |
2,500 |
6 |
|
West Midlands |
181 |
440 |
2,400 |
8 |
|
East of England |
238 |
649 |
2,700 |
10 |
|
London |
465 |
1,181 |
2,500 |
20 |
|
South East |
338 |
923 |
2,700 |
14 |
|
South West |
209 |
536 |
2,600 |
9 |
|
Wales |
97 |
228 |
2,400 |
4 |
|
Scotland |
142 |
359 |
2,500 |
6 |
|
Northern Ireland |
70 |
175 |
2,500 |
3 |
|
Unknown |
7 |
18 |
2,600 |
0 |
|
United Kingdom |
2,350 |
5,927 |
2,500 |
100 |
Source: Self-Employment Income Support Scheme statistics: August 2020
The take-up of this grant across the UK was around 69 per cent of the potentially eligible population, which was lower than for the first grant. Northern Ireland had the highest take-up rate (73 per cent), whereas the South West saw the lowest take-up rate (66 per cent). In Table 2.8, we provide data on the take-up in different regions.
|
Country/Region |
Total potentially eligible population |
Proportion of total eligible population (%) |
Take-Up Rate (%) |
|---|---|---|---|
|
England |
2,934 |
87 |
69 |
|
North East |
94 |
3 |
70 |
|
North West |
311 |
9 |
71 |
|
Yorkshire and the Humber |
240 |
7 |
70 |
|
East Midlands |
218 |
6 |
68 |
|
West Midlands |
261 |
8 |
69 |
|
East of England |
349 |
10 |
68 |
|
London |
642 |
19 |
72 |
|
South East |
501 |
15 |
67 |
|
South West |
318 |
9 |
66 |
|
Wales |
140 |
4 |
69 |
|
Scotland |
207 |
6 |
69 |
|
Northern Ireland |
96 |
3 |
73 |
|
Unknown |
13 |
0 |
53 |
|
United Kingdom |
3,390 |
100 |
69 |
Source: Self-Employment Income Support Scheme statistics: November 2020. Note: Take-up is based on total number of claims to date (excludes error and rejected cases) over total potentially eligible population (includes error and rejected cases).
Take-up of third SEISS grant
Under the third grant, a total of 2,191,000 claims were made across the UK, amounting to £6.2 billion. Self-Employment Income Support Scheme statistics: February 2020). London had the highest number of claims made (439,000), while the North East and Northern Ireland had the lowest number of claims made (62,000). In Table 2.9, we provide the number of claims across the different regions of the UK.
|
Country/Region |
Total no. of claims made to 31/1/21 |
Total value of claims made to 31/10/21 (£m) |
Average value of claims made to 31/10/21(£) |
Proportion of total number of claims made to date (%) |
|---|---|---|---|---|
|
England |
1,903 |
5,414 |
2,800 |
87 |
|
North East |
62 |
157 |
2,500 |
3 |
|
North West |
207 |
535 |
2,600 |
9 |
|
Yorkshire and the Humber |
157 |
412 |
2,600 |
7 |
|
East Midlands |
137 |
384 |
2,800 |
6 |
|
West Midlands |
170 |
461 |
2,700 |
8 |
|
East of England |
223 |
682 |
3,100 |
10 |
|
London |
439 |
1,264 |
2,900 |
20 |
|
South East |
316 |
969 |
3,100 |
14 |
|
South West |
192 |
551 |
2,900 |
9 |
|
Wales |
88 |
233 |
2,600 |
4 |
|
Scotland |
131 |
373 |
2,800 |
6 |
|
Northern Ireland |
62 |
171 |
2,800 |
3 |
|
Unknown |
6 |
18 |
2,900 |
0 |
|
United Kingdom |
2,191 |
6,210 |
2,800 |
100 |
Source: Self-Employment Income Support Scheme statistics: August 2020.
The take-up of SEISS-3 varied across the UK, from 61 per cent in the South West to 69 per cent in London. The take-up rate for the third SEISS grant averaged 65 per cent across the UK as a whole, thus decreasing in comparison with both SEISS-1 and SEISS-2. In Table 2.10, we provide data on the take up in different regions.
|
Country/Region |
Total potentially eligible population |
Proportion of total eligible population (%) |
Take-Up Rate (%) |
|---|---|---|---|
|
England |
2,915 |
87 |
65 |
|
North East |
93 |
3 |
66 |
|
North West |
309 |
9 |
67 |
|
Yorkshire and the Humber |
239 |
7 |
66 |
|
East Midlands |
216 |
6 |
63 |
|
West Midlands |
259 |
8 |
65 |
|
East of England |
348 |
10 |
64 |
|
London |
634 |
19 |
69 |
|
South East |
499 |
15 |
63 |
|
South West |
317 |
9 |
61 |
|
Wales |
140 |
4 |
63 |
|
Scotland |
207 |
6 |
64 |
|
Northern Ireland |
96 |
3 |
65 |
|
Unknown |
13 |
0 |
51 |
|
United Kingdom |
3,370 |
100 |
65 |
Source: Self-Employment Income Support Scheme statistics: February 2021. Note: Take-up is based on total number of claims to date (excludes error and rejected cases) over total potentially eligible population (includes error and rejected cases).
Universal Credit
Description
Universal Credit (UC) is a welfare scheme that first came into place in 2013, and the rollout of the scheme across Great Britain was completed by end of 2018. The government currently expects all households eligible to be transferred to the scheme by the end of 2024. UC is a payment to help people with their living costs and is paid to claimants monthly (or twice a month for some people in Scotland). UC replaced and combined six different means-tested benefits, namely:
- Child Tax Credit
- Housing Benefit
- Income Support
- Income-based Jobseeker’s Allowance (JSA)
- Income-related Employment and Support Allowance (ESA)
- Working Tax Credit.
To be eligible for UC, a person must:
- be on a low income or out of work
- be 18 or over (there are some exceptions if a person is 16 to 17)
- be under State Pension age (or have a partner who is)
- together with their partner, have no more than £16,000 in savings
- live in the UK.
The amount that can be claimed under UC consists of a standard allowance and various additional amounts that can be claimed under specific circumstances. We summarise these different elements of UC below.
Standard allowance
The standard allowance under the scheme depends on the claimant’s age and whether they are single or not. The table below shows the standard allowance for different categories of people in 2021/22.
|
Claimant’s circumstances |
Monthly standard allowance (£) |
|---|---|
|
Single and under 25 |
344 |
|
Single and 25 or over |
411.51 |
|
In a couple and both under 25 |
490.60 (for both) |
|
In a couple, one of whom is 25 or over |
596.58 (for both) |
Source: Universal Credit.
The extra amount that a person can receive due to a child depends on the number of children due to the two-child policy limit introduced 6 April 2017. If the claimant has 1 or 2 children, they will receive an extra amount per child. If the claimant has 3 or more children, they will get an additional amount for at least 2 children, but to receive more for additional children at least one of the following has to hold true:
- the child was born before 6 April 2017
- the claimant was already claiming an extra amount for 3 or more children before 6 April 2017
- other exceptions (such as multiple births and adoption).
Additional amounts are paid for disabled children irrespective of the two-child limit. Some households may also receive an amount to help pay for childcare costs.
In Table 2.12, we detail the extra amount that is paid to those with children under different circumstances.
|
Additional amount |
Extra monthly amount (£) |
|---|---|
|
For the first child |
282.50 (born before 6 April 2017) |
|
For the second child and any other eligible children |
237.08 per child |
|
If any child is disabled or severely disabled. |
128.89 or 402.41 |
|
If the claimant needs help with childcare costs |
up to 85% of the costs (up to 646.35 for one child and 1,108.04 for 2 or more children) |
Extra amount for those with a disability or health condition, and for carers
Additional amounts can also be claimed by those who have a disability or health condition, and by those who care for severely disabled people. The relevant amounts are shown in the table below.
|
Additional amount |
Extra monthly amount (£) |
|---|---|
|
If the claimant has limited capability for work and work-related activity |
343.63 |
|
If the claimant has limited capability for work and has started either health-related Universal Credit or Employment and Support Allowance (ESA) claim before 3 April 2017 |
128.89 |
|
If the claimant provides care for at least 35 hours a week for a severely disabled person who receives a disability-related benefit |
163.73 |
Source: Universal Credit
Extra amount for housing costs
Under UC a person can claim an additional amount to help pay for their housing costs. The amount that the claimant can get depends on their age and circumstances. The housing payment can help pay:
- rent to private landlord; or
- rent and some service charges if the claimant rents from a housing association or local authority.
If the claimant pays a mortgage on a home that they own, they may be able to get a loan to help with interest payments on their mortgage.
The maximum amount that is available for assisting claimants with private rental costs varies by local area to reflect the differences in private market rents across the country, this is referred to as the Local Housing Allowance.
If the claimant is from Scotland, they can choose whether the housing payment is paid to them or to their landlord, and whether it is paid monthly or twice a month.
Factors that may reduce UC entitlement
The amount of UC may be scaled back to take account of the household’s income from other sources (such as employment income) and/or savings. In some cases, the total amount available may be limited by the government’s Benefit Cap.
Additional UC support since start of COVID-19 crisis
Since the start of the first lockdown, the government has made changes to UC to support economically vulnerable households. The changes are as follows:
- Temporary uplift to standard allowance. From 6 April 2020, the government temporarily increased the standard allowance by £20 a week. This increase was initially due to remain in place for 12 months and was the first time the standard allowance increased (other than for inflation) since 2015. In its March 2021 Budget, the government extended this uplift to the standard allowance until 30 September 2020.
- Temporary suspension of the “Minimum Income Floor” for self-employed claimants. For self-employed people, the UC calculation takes actual income into account for the first 12 months of self-employment. After this, a rule called “minimum income floor” (MIF) is usually applied, under which a minimum income from self-employment is assumed. This is usually the national minimum wage for the number of hours the claimant is expected to work for, usually 35 hours a week. Due to the coronavirus lockdown, from 13 March 2020 the MIF rules were suspended for those who were ill or self-isolating due to coronavirus and from 6 April 2020 it was suspended for all self-employed people. Following the March 2021 Budget, the suspension of the MIF is due to last until 31 July 2021, after which it will be gradually re-introduced. However, Department for Work and Pensions (DWP) work coaches will have the discretion to continue to apply the suspension in individual cases where they consider that a self-employed claimant’s income continues to be affected by COVD-19 restrictions.
- Increase in Local Housing Allowance rates. In March 2020, the government announced that Local Housing Allowance rates would be increased to reflect the 30th percentile of rents in each local area.
Increased claims since start of COVID-19 crisis
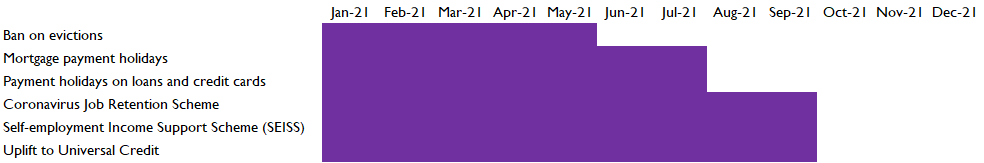
The economic impact of the COVID-19 crisis has led to a substantial increase in the number of people on UC. From 12 March 2020 to 14 January 2021, the number of people on UC approximately doubled from 3 million to 6 million (Universal Credit statistics, 29 April 2013 to 14 January 2021).
Figure 2.1 shows the weekly numbers of UC claims from 10 January 2019 to 14 January 2021. There was a substantial increase in the initial weeks of the first lockdown, particularly in the first two weeks (between 20 March 2020 and 2 April 2020) in which 1.1 million UC claims were made. This increase was over 10 times the normal level of claims.
Source: Universal Credit Statistics: 29 April 2013 to 14 January 2021.
If we look at the regional growth in the number of claims since the start of the pandemic in March, there is a significant disparity. The highest growth was seen in London (134 per cent) closely followed by the South East (118 per cent), while the lowest growth was seen in the North East (67 per cent). In Table 2.14, we provide details of growth in the number of people on UC in different regions since the pandemic started.
|
Region |
% |
|---|---|
|
North East |
67 |
|
North West |
82 |
|
Yorkshire and The Humber |
87 |
|
East Midlands |
100 |
|
West Midlands |
89 |
|
East of England |
110 |
|
London |
134 |
|
South East |
118 |
|
South West |
96 |
|
Wales |
80 |
|
Scotland |
83 |
Source: Universal Credit Statistics: 29 April 2013 to 14 January 2021
Payment holidays on debt
Mortgage payment holiday
In March 2020, the government announced the Mortgage Payment Holiday scheme. This scheme allowed homeowners struggling financially due to the COVID-19 crisis to defer mortgage payments without affecting their credit rating. Applicants could request a payment holiday for up to six months in total and for three months at a time (meaning that after the first three months, they could agree to renew the payment holiday for another three months). By May 2020, more than 1.8 million mortgage payment holidays had been taken up (HM Treasury).
The scheme has been extended a number of times. The final extension of the scheme by the FCA allowed people to submit applications until 31 March 2021 (FCA Mortgages and coronavirus: information for consumers).
Payment holidays on loans and credit cards
The Financial Conduct Authority (FCA) introduced a loan and credit card holiday scheme in April 2020 to protect borrowers struggling to pay their bills during the coronavirus lockdown. By 19 June 2020, more than 1.6 million payment holidays had already been agreed by lenders. Of this total, 961,700 payment holidays were for credit card holders. In total, 27 million interest-free overdrafts have been offered by banks to struggling borrowers (Source: Financial Times)
Despite the availability of these payment holidays, the regulator advised that those who could afford to make payments at a reduced level should do so. The scheme protects borrowers from changes in their credit rating. However, the borrower will still be charged interest during the payment holiday.
The government introduced an initiative in March 2020 that prevented landlords from evicting renters for 3 months. This ban on evictions was subsequently extended a number of times, but formally ended on 31 July 2021 (FCA Coronavirus: information for consumers with personal loans, overdrafts and other forms of credit).
Ban on evictions
In the UK there are around 8 million renters, out of which 4.5 million have private landlords, while the rest are renting from social landlords (such as councils and housing associations).
The government introduced an initiative in March 2020 that prevented landlords from evicting renters for 3 months. This ban on evictions was subsequently extended a number of times, and is currently due to end on 31 May 2021 (Housing advice: coronavirus (COVID-19), Shelter).
In mid-2020, homelessness charity Shelter conducted a study that estimated that an estimated 227,000 tenants across England have fallen behind with rent payments since the start of the pandemic and are therefore at risk of losing their homes. This research was based on a poll of 1,058 private tenants carried out by YouGov on behalf of Shelter in England between 4 June 2020 and 11 June 2020.
Other national support measures
Other national support measures for economically vulnerable households include the option to defer self-assessment payment on account and a pilot of a no-interest loans scheme. These are discussed below.
Option to defer self-assessment payment on account
One of the ways in which the UK government supported households was by deferring the payment of taxes. Self-assessment payments on accounts that were due on 31 July 2020 could be made as late as 31 January 2021. HMRC did not need to be informed of the deferral, as the last date for payment was automatically shifted if the payment was not made by 31 July 2020.
No-interest loans scheme pilot
In the March 2021 Budget, the government stated that it will provide up to £3.8 million of funding for a pilot of a no-interest loans scheme. The aim of the scheme is to provide vulnerable consumers with an alternative to high-cost credit by providing them with “affordable short-term credit”.
Summary of timeline for withdrawal of national support policies
The figure below summarises the announced timeline for the withdrawal of various COVID-19 support policies over the course of 2021. By October 2021, all the support policies will have been removed (in the absence of any further extensions to any of these measures).
3. Key Local Support Measures
This section discusses some of the support policies which councils have put in place, either during the pandemic or before it, to support economically vulnerable households.
The information presented in this section has been obtained from a questionnaire that the LGA distributed to councils in February 2021. Out of the 339 councils in England, 36 councils (just over 10 per cent) responded to the questionnaire. The number of responses varied across questions, as some councils did not respond to certain questions, either because they did not have the relevant information or because the question was not relevant to them. In cases where answers were incomplete or appeared to be erroneous, they were excluded from the analysis.
We discuss measures by local authorities to support economically vulnerable households in relation to:
- council tax liability
- housing
- other needs (including food and other essentials).
Council tax liability
Local authorities have assisted households that have been struggling to pay their council tax bills because of the pandemic. Below, we discuss:
- the impact of the crisis on the collection of council tax revenues
- requests by households for alternative payment arrangements
- the approach taken by councils to enforcing council tax collection during the crisis
- the Council Tax Reduction schemes run by councils
- the additional council tax relief that has been provided from the government’s COVID-19 hardship fund.
Impact of crisis on collection of council tax revenues
Council tax is one of the main sources of revenue for local councils. In 2018/2019, council tax revenues represented 52 per cent of the total funding for councils in England (Institute for Government - “Local Government Funding in England”). This means that the collection of council taxes is of high importance for councils.
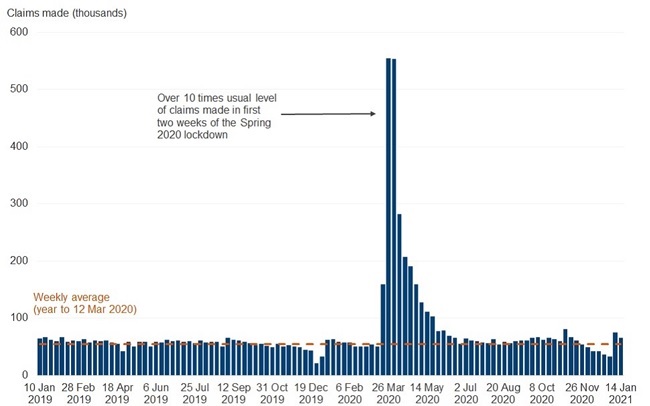
Twenty-seven councils responded to questions relating to the council tax collected during the first three quarters of 2019 and 2020. As a result of the COVID-19 crisis, these councils experienced a small reduction averaging 1.7 per cent percentage points in the council tax that they collected (from 94.1 per cent in the first three quarters of 2019 to 92.4 per cent in the first three quarters of 2020).
Responding councils in Greater London saw the highest decrease in the percentage council tax collected (3.7 percentage points), while responding councils in Yorkshire and the Humber surprisingly saw the percentage council tax collected increase slightly (by 0.3 percentage points). In the chart below, we show how the percentage of council tax collected changed across the different regions in England for responding councils.
Alternative payment arrangements
The COVID-19 crisis has led to some households requesting alternative payment arrangements for council tax, according to those councils able to provide information on this issue:
- On average, 10 per cent of council tax support claimants had requested an alternative payment arrangement due to COVID-19.
- Further, an average of 5 per cent of other council tax payers had also requested an alternative payment arrangement due to COVID-19.
(This analysis is based on only a few responding councils. The number for council tax support case load is based on 7 responses and the number for other council taxpayers is based on 13 responses.)
Approach to council tax enforcement during the crisis
During the months of lockdown, 21 of the responding councils temporarily suspended council tax enforcement, and 14 used light touch recovery through adapted letters. In the table below, we list the different approaches that councils adopted for enforcement and the number of responding councils that adopted those approaches. (Note that councils may be using more than one approach for enforcement.)
|
Type of approach |
Number of responding councils |
|---|---|
|
Temporarily suspended enforcement - either formally or informally |
21 |
|
Light touch recovery through adapted letters |
14 |
|
Normal payment reminder letters |
12 |
|
Other |
8 |
While 64 per cent of the responding councils have restarted full enforcement (excluding summonses), 18 per cent of councils plan to restart enforcement in the next financial year, while 18 per cent said that they had “no plans currently to resume full enforcement actions”. Most of the responding councils that have restarted full enforcement restarted in August 2020.
|
Month in which the council started or will start enforcement |
Number of responding councils |
|---|---|
|
Jul-20 |
1 |
|
Aug-20 |
9 |
|
Sep-20 |
1 |
|
Oct-20 |
0 |
|
Nov-20 |
3 |
|
Dec-20 |
0 |
|
Jan-21 |
3 |
|
Feb-21 |
1 |
|
Next financial year |
5 |
|
No plans currently to resume full enforcement actions |
5 |
Council Tax Reduction schemes
Since April 2013, councils in England have been running their own local schemes to help economically vulnerable households with council tax payments / bills. This benefit is known as the Council Tax Reduction schemes and replaced the national council tax benefit scheme. The Council Tax Reduction schemes aim to help vulnerable households by providing them with a reduction in their council tax liability.
Under these schemes, households that meet certain criteria are entitled to a reduction in their council tax. In some local areas, households can receive a council tax reduction of up to 100 per cent. As each council has its own Council Tax Reduction scheme, the eligibility criteria and the amount of reduction varies from council to council.
Twenty-six councils responded to the question about the average reduction in council tax they provide under this scheme. This varied significantly across the different councils, with the lowest average reduction of 12 per cent being provided by Wirral (a metropolitan district) in the North West, and the highest being provided by Lambeth in Greater London (100 per cent). In the table below, we display the number of responding councils that are categorised in terms of average Council Tax Reduction.
|
Average reduction (%) |
Number of responding councils |
|---|---|
|
Government’s default scheme (average reduction varies) |
6 |
|
11 to 25 |
8 |
|
60 to 80 |
8 |
|
81 to 100 |
4 |
When looking at the maximum reduction in council tax offered by the responding councils, we note that most councils (19) offered reductions greater than 70 per cent, while 4 councils offered maximum reductions that were lower than 30 per cent.
|
Maximum reduction (%) |
Number of responding councils |
|---|---|
|
11 to 30 |
4 |
|
70 to 80 |
8 |
|
81 to 90 |
6 |
|
100 |
5 |
Local councils determine what reduction households are eligible for based on different criteria. Among the responding councils, 70 per cent consider the council tax band that a household falls into, 96 per cent consider household savings, and 46 per cent consider income.
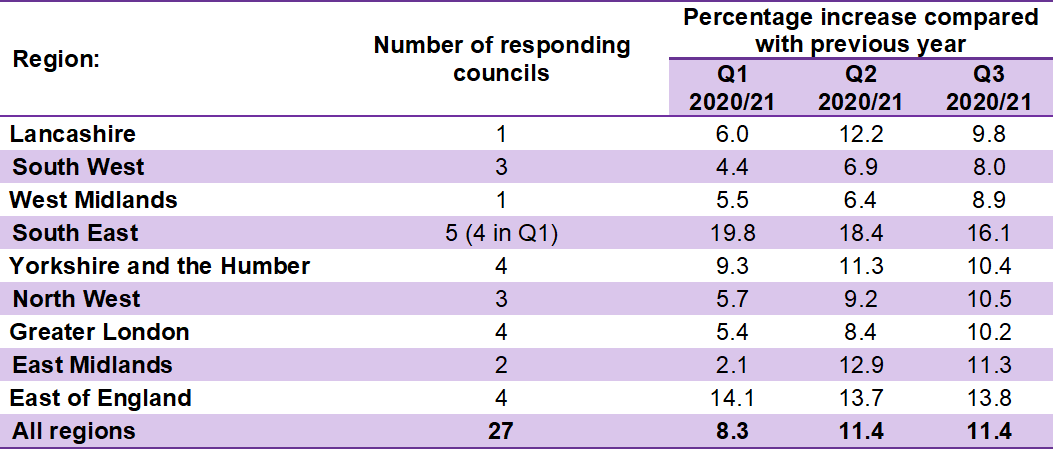
For responding councils, the number of working age households that receive Council Tax Reduction has increased significantly since the start of the pandemic. These councils reported that the number of households receiving Council Tax Reduction was 8.3 per cent higher in the first quarter of 2020/21 than the same time a year previous and was 11.4 per cent higher than a year earlier in the second and third quarters of 2020/21.
Responding councils in the South East saw the biggest increase in the number of households that received Council Tax Reduction, with a 19.8 per cent increase on a year earlier in the first quarter of 2020/21. In the table below, we display the percentage change in the number of working age households that received Council Tax Reduction for responding councils in different regions in England.
Additional council tax relief from COVID-19 hardship fund
In 2020, the UK government provided local councils with a fund worth £500m to help them support economically vulnerable residents, through additional council tax relief. The fund was divided among councils based on each councils’ share of the national working age caseload for Council Tax Reduction. The Government’s intention was that billing authorities would provide all recipients of working age Council Tax Reduction a further reduction of £150 from their annual council tax bill for the financial year 2020-21.
As of 31 December 2020, an average of 78 per cent of the fund allocated had been spent by the responding councils. York and Hambleton had spent all of the fund allotted to them, while Bristol had spent the least (8 per cent). Most of the responding councils (54 per cent) had expected the funding to be spent by end of March 2021, while 46 per cent expected to carry it over to the next financial year. In the table below, we show exactly when the responding councils expect the funding to run out.
|
Month when it will run out |
Number of responding councils |
|---|---|
|
Feb-21 |
1 |
|
Mar-21 |
12 |
|
Next financial year |
11 |
|
Funding already exhausted |
2 |
While 50 per cent of the responding councils used only their allocation of the fund to provide additional discretionary support to residents, only 19 per cent (4 councils) provided support greater than the minimum level i.e. £150 per household.
Housing
In this sub-section, we discuss the support that local authorities have provided in the following areas:
- the provision of temporary accommodation for homeless people
- discretionary housing payments to assist those struggling to pay for their housing.
Provision of temporary accommodation
One of the support measures that councils provide is temporary accommodation to those who are homeless. Temporary housing can include a private flat, a council flat, or supported housing.
While relatively few councils responded to survey questions about temporary accommodation, the councils that did respond mostly reported an increase in spending, with expenditure increasing by very substantial amounts in certain cases.
Discretionary Housing Payments
A Discretionary Housing Payment (DHP) is an extra payment that may be made by local councils to residents who are struggling to pay rent. Residents are not required to repay any DHP they receive from their council and councils have discretion over whether to accept or decline applications made to the scheme.
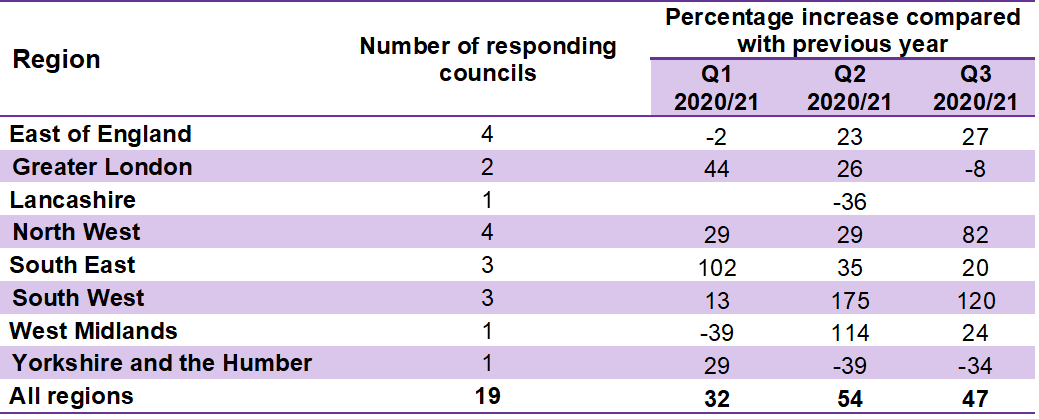
As shown in Table 3.7: DHP spending by responding councils in different regions, in general those councils which responded to the relevant question in the LGA survey have been spending more money on DHP since the COVID-crisis began (although there were some councils which were exceptions). Across the 19 councils which responded to this question, spending on DHP was 32 per cent higher than a year previously in the first quarter of 2020/21, 54 per cent higher in the second quarter, and 47 per cent higher in the third quarter.
Table 3.7: DHP spending by responding councils in different regions
Council policies to assist with other needs
In this sub-section, we discuss in turn:
- the range of support schemes run by local councils, whether pre-existing or set up in response to the COVID-19 crisis
- the provision by councils of food and other essentials from Defra’s Emergency Assistance Grant for Food and Essential Supplies
- the support provided by councils from the government’s COVID Winter Grant Scheme
- the provision of free school meals for children from economically vulnerable households.
Support schemes run by local councils
Responding councils have also provided other kinds of schemes of support to economically vulnerable households during the COVID-19 crisis. This support has mostly been provided through pre-existing schemes, although some councils have set up new programmes. In the table below, we show the number of responding councils that provide different types of support schemes, and whether the schemes are pre-existing or newly set up.
|
Does the council provide: |
Yes – pre-existing scheme in place |
Yes – new scheme set up |
No |
|---|---|---|---|
|
Local Welfare Assistance scheme |
16 |
4 |
5 |
|
Schemes to supply food/fuel/other essentials |
15 |
8 |
4 |
|
Provision of debt advice |
15 |
3 |
7 |
|
Schemes to support mental health |
10 |
5 |
5 |
|
Assistance with job finding/training for new roles |
8 |
4 |
10 |
Of those responding councils that had pre-existing schemes in place, most of the councils saw spending on these increase due to the COVID-19 crisis. All responding councils reported an increase in spending on schemes to provide households with essentials such as food and fuel.
|
Schemes or support provided by the responding council |
Percentage of existing schemes where spending increased (excluding don't know) |
|---|---|
|
Local Welfare Assistance scheme |
94% |
|
Schemes to supply food/fuel/other essentials |
100% |
|
Provision of debt advice |
69% |
|
Schemes to support mental health |
75% |
|
Assistance with job finding/training for new roles |
83% |
Provision of food and other essentials from Emergency Assistance Grant for Food and Essential Supplies
In June 2020, the government announced a £63m fund for councils to provide help with food and other essentials. It was launched as a short-term funding plan, with the funds to be used from July 2020 onwards and to be spent within 12 weeks.
In the LGA survey, councils were asked how this fund had been spent. The most common answer among responding councils was that the fund was used to provide funding to food banks, charities, or partner organisations. Other common answers were that the grant was used to fund direct provision of food and other essentials by the council or to offer a voucher for this purpose.
|
Emergency Assistance Grant for Food and Essential Supplies used for |
Number of responding councils |
|---|---|
|
Provision of funding to food banks/charities/partner organisations |
17 |
|
Provision of vouchers to residents for food and other essentials |
14 |
|
Direct provision of food parcels by council |
13 |
|
Direct provision of other essential supplies by council |
13 |
|
Provision of cash payments to residents for food and other essentials |
5 |
|
Gave it to district councils to support residents in need |
3 |
|
Other |
5 |
Support provided from COVID Winter Grant Scheme
The UK government introduced the COVID Winter Grant Scheme in early December 2020, that was worth a total of £170 million. It was intended to help councils across England support the most vulnerable households with the costs of food, energy, water bills and other essentials through the winter period. The grant funds were distributed among county councils and unitary authorities by the DWP and were made available until the end of March 2021.
Eligibility criteria for the distribution of funds is flexible, varying from council to council; however, there are certain guidelines that the authorities must adhere to when selecting households to support:
- at least 80 per cent of the total funding should be ring-fenced to support households with children. (For the purpose of this grant, the definition of a child was any person aged under 19 or a person aged 19 and above eligible for child-related benefits or for free school meals.). Up to 20% of the total funding can be allocated to other households experiencing, or at risk of experiencing, poverty during the pandemic
- at least 80 per cent of the funding is ring-fenced for households in need of support in paying for food, and for energy, water and sewerage bills. Up to 20% of the total funding can be allocated to support with other related essentials.
- for the purpose of the grant, other vulnerable households eligible for the scheme include those aged 19 to 25 with special educational needs and a disability and/or care leavers.
Households in receipt of other forms of support could still be considered for the grant by authorities and councils provided they met one of the following:
- have additional, wider needs in terms of food
- need support with provision for cooking, heating, lighting and/or water
- require other essential supplies.
The COVID Winter Grant Scheme was ring-fenced, and any unspent funding needed to be repaid to the DWP. The funds were provided to local authorities in three instalments:
- 50 per cent of the allocation was provided at the start of the scheme
- 25 per cent was paid at the end of February 2021
- 25 per cent of funds was paid at the end of the scheme.
In the LGA survey, responding councils were asked to providing rankings for different approaches to spending the money, based on which approach received the most funding. The average rank provided by responding councils is shown in the table below. These councils allocated most funding to the provision of vouchers to residents for food and other essentials. Funding food banks, charities or partner organisations and the direct distribution of food parcels received the next highest rankings. The least funding was allocated to the distribution of cash for food and other essentials.
|
Schemes funded through Winter Grant Scheme |
Average rank among responding councils |
|---|---|
|
Provision of vouchers to residents for food and other essentials |
1.6 |
|
Provision of funding to food banks/charities/partner organisations |
3.4 |
|
Direct provision of food parcels by council |
3.6 |
|
Direct provision of other essential supplies by council |
4.0 |
|
Provision of cash payments to residents for food and other essentials |
4.5 |
Provision of free school meals
Another type of support that councils provide is free school meals for children from economically vulnerable households. Almost all responding councils reported that applications for free school meals had increased since the start of the COVID-19 crisis in March 2020. On average, responding councils reported that 19.9 per cent more children were receiving free school meals in October 2020 compared with a year earlier.
|
Region |
Number of responding councils |
Change (%) |
|---|---|---|
|
South West |
1 |
14.5 |
|
West Midlands |
3 |
26.0 |
|
South East |
4 |
17.0 |
|
Yorkshire and the Humber |
2 |
27.0 |
|
North West |
1 |
20.2 |
|
Greater London |
2 |
11.1 |
|
East Midlands |
1 |
24.0 |
|
East of England |
2 |
17.4 |
|
England |
16 |
19.9 |
4. Potential Impacts on Regional Unemployment
We have modelled the potential economic impacts of the COVID-19 crisis on employment in the regions of the UK. By understanding, firstly, the sectoral economic makeup of the different regions, and, secondly, how each sector is affected by the crisis, we can approximate the potential scale of the problem of households entering a state of economic vulnerability.
The main findings from our scenario modelling are:
- the UK unemployment rate immediately after the furlough scheme ends at the end of September 2021 could range between 5.1 and 6.8 per cent
- in the event that there is a third wave of infections in Autumn 2021 (e.g. due to a new strain of the virus) and a subsequent lockdown, the unemployment rate could rise – without the resumption of the furlough scheme and absent any other support measures – to nearly 15 per cent
- depending on the extent of economic scarring caused by over a year of below-trend economic output, the unemployment rate could return to the pre-pandemic level either by the beginning of 2022 or in several years’ time
- the modelled unemployment rate in our central (medium) scenario is slightly more optimistic than the recent projections of the OBR and the Bank of England
- the projected unemployment in our scenarios varies by region, with the highest unemployment rate once the furlough scheme ends being in the North East.
Modelling approach
The economic scenarios
Our modelling has employed three scenarios that Europe Economics has developed for how the COVID-19 crisis might evolve from this point onwards. The purpose of the scenarios is to capture a range of plausible economic outcomes based on assumptions about how the pandemic, and responses to it, might develop over time:
- short scenario – this assumes that the vaccination programme is successful and allows the economy to be fully re-opened without this leading to a third wave of COVID-19. It also assumes that any economic “scarring” from the crisis is limited, such that by December 2021 the economy has returned to its long-term trend
- medium scenario – this also assumes a successful vaccination programme and no third wave of COVID-19 but assumes that the economic disruption experienced over the past year induces 18 months of economic “scarring” after an initial economic recovery following the recent third lockdown. These scarring effects taper away gradually over 18 months, resulting in the economy reverting to its long-term trend output level in December 2022
- extended scenario – this is a more pessimistic scenario which assumes a fourth lockdown towards the end of 2021. For example, this might reflect the emergence of new coronavirus variants which are vaccine-resistant. The lockdown directly reduces economic activity and also contributes to greater economic “scarring” which then tapers away over 3.5 years.
In the extended scenario, we assume the fourth lockdown causes only 30 per cent of the economic damage caused by the first lockdown in the spring of 2020. This is due to the assumption that there is learning and adaptation across the economy, so that more firms will be able to maintain operations during periods of more stringent COVID-19 restrictions. Alternatively, it could be due to lockdowns only being applied in some regions, although the effect of only applying restrictions in some regions is outside the scope of our modelling work. It may also be the case that vaccines have some effect against new variants of coronavirus, even if they are less effective against them than against current strains. In this case, the vaccine programme could also help to reduce the economic impact of a fourth lockdown, as less stringent restrictions might be needed to prevent the virus spreading.
The trend in our unemployment model is defined as the 2018 level of estimated GVA in each sector and region (adjusted to 2020 prices) changing at the rate of real GDP growth between 2010 and 2019.
Economic activity inputs to the model
Figure 4.1 shows the output deviations from the long-term trend during the crisis so far, based on historical data for output deviations from 2019 levels and combined with our scenario assumptions for how GVA will evolve going forward.
First, the figure shows the impact of the first lockdown in the initial drop in output (relative to the assumed long-term trend) of approximately 25 per cent in April 2020. It also shows the smaller drops caused by the nationwide “circuit-breaker” lockdown in November 2020, and the third lockdown beginning in January 2021. This outturn data shows that the second (November 2020) and third (Jan-21 to March 2021) lockdowns had less of an impact on output than the first. In February 2021, the latest month with available GVA data at the time of preparing this report, GVA was down approximately 8 per cent when compared with the economy’s long-term trend.
Second, the figure shows our three scenarios for how the economic situation may evolve. We assume output to be 2.4 per cent below the long-term trend in June 2021 in all the scenarios before the scenario trajectories begin to diverge. The lockdown period in the extended scenario (shaded light pink), leads to a large drop in output between October 2021 and February 2022. The different degrees of economic scarring in the three scenarios means that output reverts towards the long-term trend (i.e. where output deviation is zero) over different time periods.
Figure 4.1: Assumptions for the deviation of output from the long-term trend under each scenario
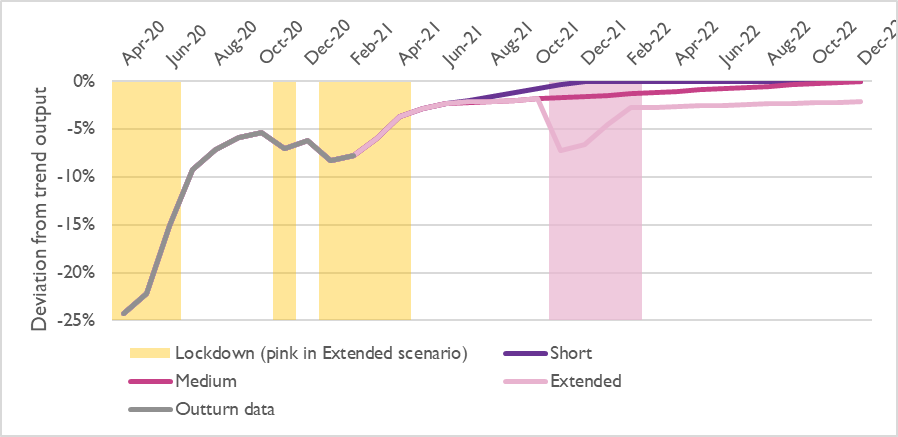
Note: “Outturn data” series shows the growth relative to the long-term trend implied by the assumed trend growth rate and outturn year-on-year GVA growth until February 2021 (ONS, 2021). Source: Europe Economics analysis.
We use the relationship between total economy-level GVA changes and sector-level GVA changes during the third (most recent) lockdown, to translate the assumed GVA deviations in future months into sectoral impacts. Using the most recent lockdown for which outturn GVA impact data is (partially) available incorporates some of the learning effects referred to above. We then combine these sectoral impacts with data on the sectoral composition of regional economies to derive sector-specific changes in output relative to the long-term trend in each region.
Sector-specific output changes by region enable the model to generate estimated changes in regional employment (before accounting for the furlough scheme, which is discussed separately below). This is done by calculating a worker productivity figure for each sector, from national data for that sector on GVA levels and the number of jobs. Then, we use this figure to work out what the output changes mean for changes in the number of jobs in each sector and region. To capture productivity growth through time, the productivity figures are assumed to grow at the long-term trend growth rate of the economy’s GVA. A baseline number of jobs in each sector and region is estimated by multiplying regional GVA in each sector by the initial productivity figures.
The unemployment rate in each region is calculated by first comparing the ratio of the number of jobs that are estimated to be lost because of GVA deviations from trend in each scenario, to the baseline number of jobs in each region (as estimated by the model). Second, this ratio is applied to the actual number of employed persons before COVID-19, as given in ONS data to calculate the estimated number of employed workers that may lose their jobs. Finally, the estimated number of job losses are added to the initial unemployment count in each region to provide a total unemployment count in each region. This is then divided by the number of economically active persons in each region, thereby yielding a regional unemployment rate.
Estimating the number of furloughed workers by sector and region
Data is available on the proportions of the workforce in each sector on furlough in past time periods. However, since we are projecting forwards the evolution of employment, we rely on a method for estimating how many workers may be on furlough given the assumed deviations from trend output. This is explained below.
The ONS Business Impact of COVID-19 Survey (BICS) and, in more recent periods, the Business insights and impact on the UK economy survey has reported the proportion of responding firms’ workers furloughed in the previous two weeks since March 2020. Where data is available, we have used the proportions amongst all firms that have not permanently stopped trading, broken down by industry, and weighted by employment. The BICS data can be combined with estimates of employment (excluding the share of self-employed workers) in each region-sector, to generate the estimated number of furloughed jobs.
Further estimation is required to estimate the number of furloughed jobs beyond the data period under our scenario assumptions. (At the time of preparing this report, the most recent Business insights and impact on the UK economy data available covered Wave 25: 8 to 21 February 2021). To do this, we first take the ratio of the proportion of a sector’s workforce on furlough to that sector’s output deviation from trend in a recent period. This gives the change in the proportion of employees furloughed for each percentage point of GVA deviation from trend. We then combine this value with the assumed deviation from trend output in each sector in future months and also the estimated number of jobs in each region and sector.
For periods in which the furlough scheme is in place, the level of unemployment implied by the GVA deviations is reduced by the number of workers on furlough. In some cases, the number of furloughs exceeded the estimated number of job losses. The model therefore includes a rule which prohibits this from happening and causes net job losses in the relevant regions-sector to be zero. This mitigates the unemployment impacts in those periods.
Results and discussion
UK-level unemployment impacts
Figure 4.2 below shows the monthly unemployment rate for each model scenario between April 2021 and October 2022. At the end of September 2021, the furlough scheme is assumed to end (in line with current government policy), causing an increase in the estimated unemployment rate in every scenario (to 5 per cent in the short scenario and 6.6 per cent in the other two, for the month of October). Thereafter, the different degrees of economic scarring assumed in the short and medium scenarios means that unemployment comes back down to the pre-pandemic level at different speeds in each scenario. By contrast, in the extended scenario, a fourth lockdown beginning in November 2021 causes a significant further increase in job losses, which is no longer mitigated by the furlough scheme. Consequently, the unemployment rate in this scenario increases to 14.7 per cent. This demonstrates that a fourth national lockdown in the autumn could cause unemployment to rise substantially if it is not accompanied by adequate support mechanisms (such as an extension of the furlough scheme).
Figure 4.2: Potential UK unemployment rates in each scenario, assuming the furlough scheme is withdrawn at end-September 2021
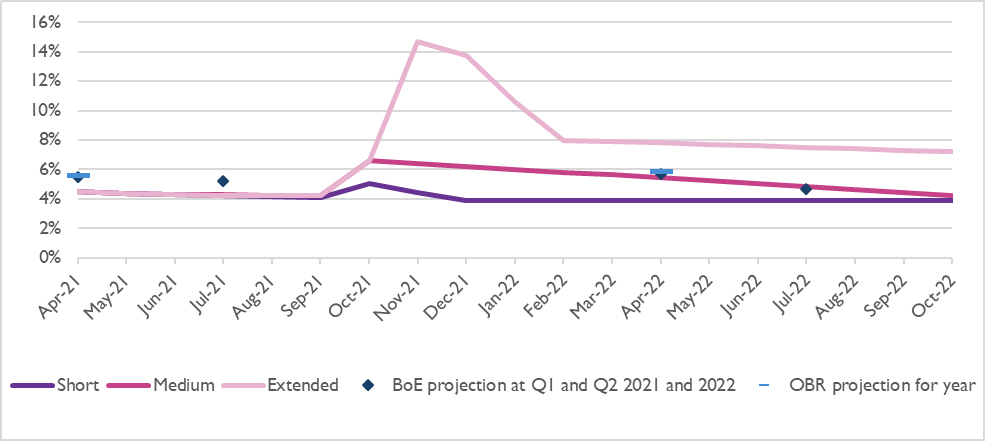
Source: Europe Economics analysis. OBR projection: “Economic and fiscal outlook – March 2021”. BoE (Bank of England) projection: “Monetary Policy Report February 2021”.
The modelled unemployment rates under the medium scenario are more optimistic than the Bank of England’s (BoE) projection for July 2021 and the Office for Budget responsibility’s (OBR) projection for 2021 (see Table 4.1, below). The modelled unemployment rate in the medium scenario in April 2022 is also slightly more optimistic than the OBR rate. However, by the end of Q2 2022 (July 2022), the medium scenario implies an unemployment rate of 4.8 per cent, which is broadly in line with the BoE’s forecast for the same period (4.7 per cent).
Whilst the OBR projections account for the closure of furlough at the end of September 2021 (precipitating an increase in unemployment around October 2021, similar to what is modelled here – see Appendix 1 for more details), neither the OBR nor the BoE assume a fourth lockdown in the autumn. The extended scenario thus represents a much more pessimistic scenario than those considered by these bodies.
Table 4.1: Unemployment rates implied by the scenarios and comparison with official estimates
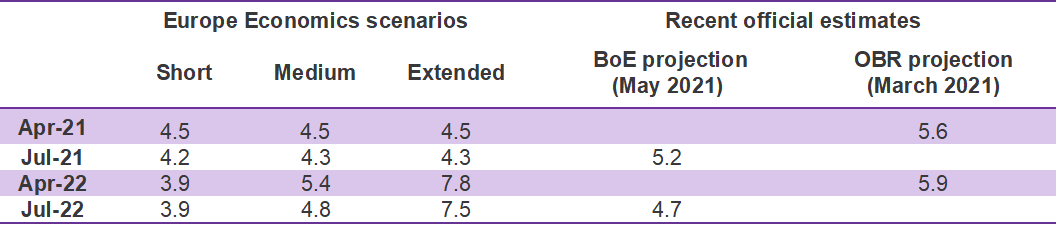
Source: Europe Economics analysis. OBR projection: “Economic and fiscal outlook, March 2021”. BoE (Bank of England) projection: “Monetary Policy Report, May 2021”
The modelled unemployment rate diverges to a greater degree from OBR and BoE projections during the assumed fourth lockdown in the extended scenario. However, the OBR’s November 2020 “downside scenario” projected 11 per cent unemployment in 2022 and its central forecast projected 7-8 per cent in mid-2021 (these projections can be found in Appendix 1.
Regional unemployment impacts
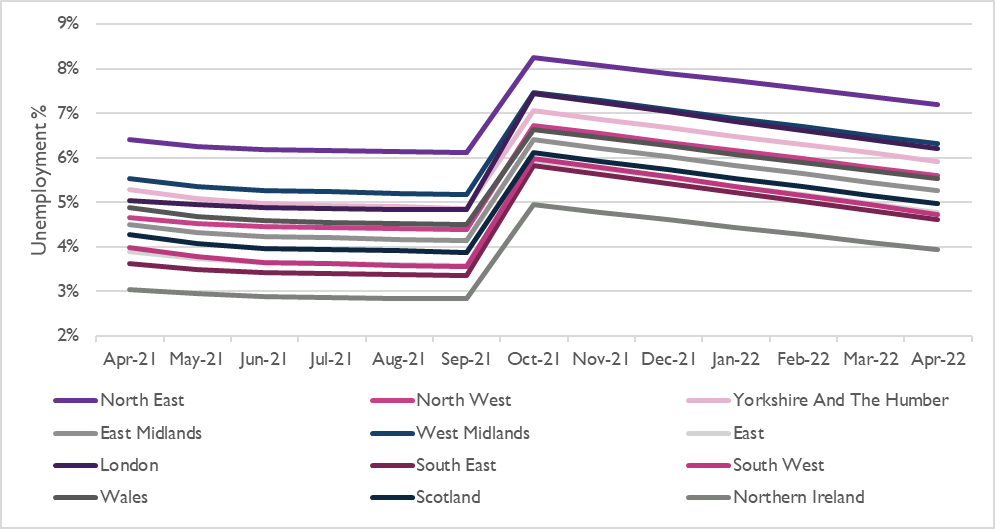
Figure 4.3 shows the unemployment rates in high-level NUTS 1 regions from April 2021 to April 2022. Throughout mid-2021, the unemployment rates in the East, South East, South West, Scotland, and Northern Ireland reach, or become lower than, the pre-COVID unemployment rate of the UK. The impact of the closure of the furlough scheme in September 2021 is clearly visible in the jump in unemployment rates in October. From this point, however, the job market in each region begins a gradual recovery as the economy continues to recover from the crisis, coincidingly bringing the unemployment rates downwards slowly.
The North East is modelled to experience the highest unemployment rate in October 2021, reaching 8.3 per cent after the furlough scheme is closed. The North East also started with the highest pre-COVID unemployment rate (5.8 per cent), and its rate increases by 43 per cent relative to its initial rate. The West Midlands reaches the second highest rate in October 2021 (7.5 per cent), followed by London (7.4 per cent) and Yorkshire and The Humber (7.1 per cent).
The South West and the South East, on the other hand, experience increases in their unemployment rate to the greatest extent relative to their initial rates (96 per cent and 93 per cent increases, respectively).
The South West’s unemployment rate stood at 3.1 per cent before COVID-19. Its accommodation and food service activities sector are the largest of all the NUTS 1 regions, at nearly 4 per cent of the region’s total GVA. This sector has been hit especially hard by lockdowns, with its GVA deviations from trend consistently and significantly exceeding the average across all sectors since April 2020. BICS figures show that the sector has also experienced one of the highest proportions of workforce on furlough – over half of the workforce is estimated to have been furloughed in February 2021 – so the withdrawal of this support measure may therefore be felt acutely in the South West.
Figure 4.3: Unemployment rates in the modelled medium scenario, by NUTS 1 region, April 2021 to April 2022.
Source: Europe Economics analysis.
The South East had the second-lowest pre-COVID unemployment rate of just 3 per cent. The region has moderately large construction, wholesale and retail trade sectors, which were affected significantly during the first lockdown, but experienced more modest deviations in the third. So, these sectors do not appear to be driving the increase in the unemployment rate. However, the region’s administrative and support service activities and the arts, entertainment and recreation sectors are also relatively large, and these sectors have experienced above-average GVA impacts relative to trend throughout the crisis and above-average numbers of workers on furlough.
Projected unemployment rates vary more by regions at the lower level of aggregation. To illustrate this, we have presented results for the NUTS 2 regions with the highest and lowest unemployment rate peaks in October 2021 under the medium scenario. The West Midlands, Tees Valley and Durham, and East and North East Outer London are predicted to have the highest unemployment rates, reaching 9.3 per cent, 8.3 per cent and 8.1 per cent, respectively. At the same time, the unemployment rates in Northern Ireland and North Yorkshire reach just 4.9 per cent and 5.1 per cent respectively. Figure 4.4 also shows the predicted GVA deviations from the long-term trend throughout the period.
Figure 4.4: The evolution of unemployment rates in a selection of NUTS2 regions, April 2021 to April 2022, under the medium scenario
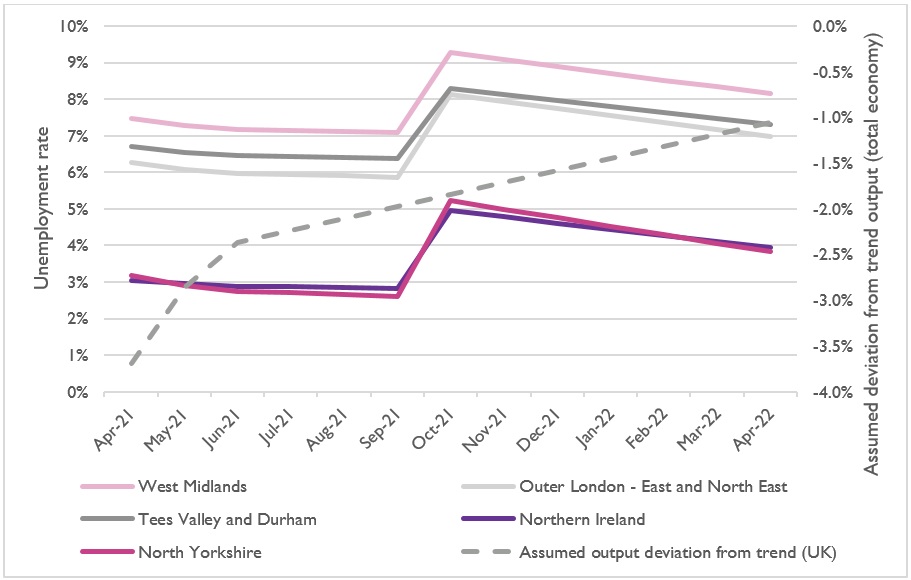
Source: Europe Economics analysis.
We have also presented results for the NUTS 2 regions with the highest and lowest unemployment rate peaks in November 2021 under the extended scenario. This is shown in Figure 4.5 below.
The modelling projects a high increase in unemployment in November 2021 in Cornwall and Isles of Scilly and the West Midlands, reaching 17.8 per cent and 17.1 per cent, respectively. Under the extended scenario, without the furlough scheme to mitigate job losses, these regions are estimated to experience high unemployment in a hypothetical third wave in Autumn/Winter 2021. In contrast, the lowest November 2021 unemployment rate peaks are expected amongst Northern Ireland (12 per cent), Berkshire, Buckinghamshire, Oxfordshire (13.3 per cent) and Southern Scotland (13.6 per cent).
Figure 4.5: The evolution of unemployment rates in a selection of NUTS 2 regions during a fourth lockdown in Autumn/Winter 2021, under the extended scenario
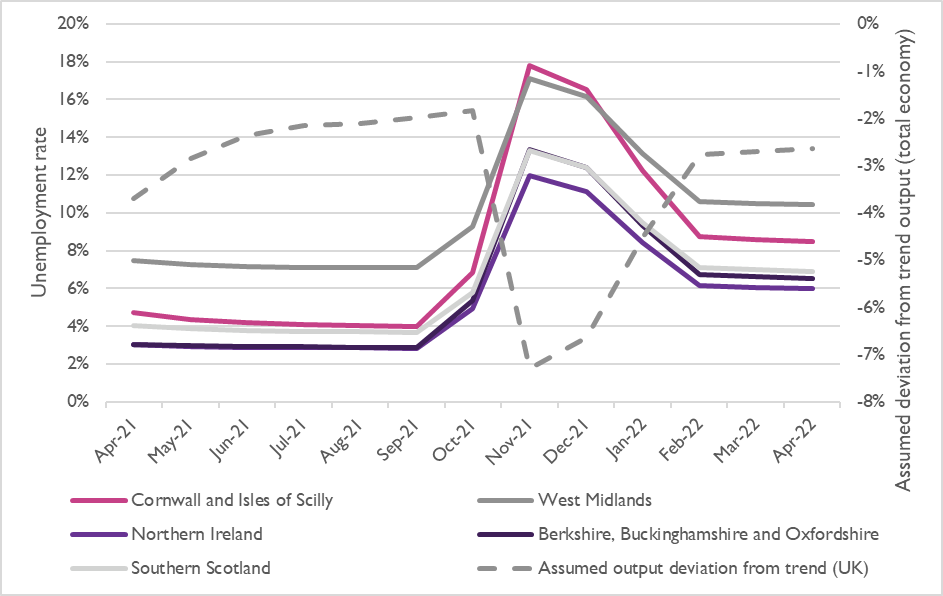
Source: Europe Economics analysis.
The West Midlands began the period with a relatively high unemployment rate, entering the pandemic with 6.6 per cent of economically active persons without a job. It is possible that a relatively significant retail and wholesale trade sector contributes to the peak rate projected in November 2021. In Sandwell, Walsall and Wolverhampton, the retail and wholesale sector accounts for more than 15 per cent of GVA. In contrast, Cornwall and Isles of Scilly entered the pandemic with a low unemployment rate of 3.2 per cent. A fourth lockdown is projected to increase this rate, potentially due to a large retail and wholesale trade sector (approximately 12 per cent of the region’s GVA) and the second largest accommodation and food service activities sector, as a proportion of GVA (7.1 per cent). (The largest is Lochaber, Skye and Lochalsh, Arran and Cumbrae and Argyll and Bute, where the accommodation and food service activities sector accounts for 10.3 per cent of the region’s GVA).
A breakdown of unemployment rates in other NUTS 2 regions between September 2021 and April 2022 can be found in the Appendix, showing the impact of the withdrawal of the furlough scheme at the end of September 2021 in each area.
Caveats and limitations
As with any modelling exercise, we reached these results by making a number of assumptions. Firstly, the monthly national economic impacts of the crisis after February 2021, where data is yet to be published, have been determined by Europe Economics on the basis of our three scenarios. Secondly, we have assumed that absent the crisis, the economy would have grown at a long-term trend of 0.15 per cent per month. This serves as the counterfactual against which output and employment impacts are measured. Thirdly, the pre-COVID economy (in terms of employment, output and sectoral makeup) is based on recent previous periods for which both 1) data are available, and 2) we can be reasonably certain that the data does not already account for impacts of the crisis. For example, unemployment data is available as of March 2020, but we have chosen to use the data on unemployment in December 2019 (published April 2020) to satisfy criterion (2). The numbers of economically active people – the basis for calculating unemployment rates – is assumed to remain unchanged over the period.
Our modelling approach enables us to estimate how output deviations from the long-term trend affect the number of workers required to produce the economy’s output in a given month. When output is below the trend, the workers that were producing that output are assumed to enter one of two states: they either become furloughed or they lose their job. In reality, the number of jobs in the economy is likely to adjust more slowly over time than our model might suggest, due to factors such as labour-hoarding by firms and restrictions in employment law, which limit the ability of firms to “hire and fire” (e.g. legal procedures for making redundancies). Our model therefore yields potentially large falls in employment during periods of significant output deviation, which may overstate the true impact on employment. This caveat should be borne in mind in interpreting our model results.
The modelling approach has been refined to avoid the risk that a region’s unemployment rate is distorted by the lost jobs of workers who commute from another region. The calculation of unemployment rates involves applying the percentage change in GVA-supported jobs to regional pre-COVID employment figures. This reduces the potential bias of overcounting non-resident workers, which is especially important for the unemployment rates of London and the South East, but assumes that a worker who lives in a region has an equal probability of losing their job as a commuter from outside the area.
5. Potential Impacts on Economically Vulnerable Households
We have modelled the impact of various support mechanisms on the finances of six stylised households in 14 geographical regions and countries within the UK. This involves the nine regions of England, plus the aggregate of England, Scotland, Wales, Northern Ireland and the UK overall. The analysis has focused on a set of stylised economically vulnerable households which entered the pandemic with varying degrees of debt or savings.
Modelling approach
The approach to modelling the finances of households involves two main elements:
- the assumed characteristics of the households.
- the policy support mechanisms available for some of the modelled period (April 2020 to December 2021).
Each of these is described in turn.
Stylised households
Table 5.2, below, shows the broad characteristics of the stylised households, whose finances during the modelled period have been simulated. Households of each level of relative financial resilience are split into single-parent households with two children, and two-parent households with two children, giving a total of six households. All our stylised households are assumed to live in two-bedroom properties.
Employment status
We assume that the employment status of all but one of the households is affected by the COVID-19 crisis. The adult(s) of households 2 to 5 are assumed to have lost their jobs and their income becomes fully dependent on Universal Credit (UC). Household 1 is assumed to have been dependent on UC before the crisis and continues to be so during it. Household 6 continues to have one adult in full-time employment and one adult losing employment, so UC is claimed to supplement lost household income.
For those households that move onto UC during the pandemic, we make some assumptions regarding the salaried income that was received before they lost their jobs when the pandemic hit. This facilitates the modelling of a ‘grace period’ for a total of nine months, during which the Benefit Cap does not limit the total UC amount which can be received following the loss of employment. We assume that the households that lose their jobs must have earned at least £569 (as per the ‘grace period’ rules) a month for each of the 12 months that started between April 2019 and March 2020 (Citizens Advice (reviewed January 2021) “Check how much Universal Credit you'll get”).
Income
For the one household assumed to remain with an employed parent (household 6), regional disposable income is estimated by scaling the UK average household disposable income (after tax and receipt of benefits) of the non-retired lowest decile in 2019-20 from the ONS (Household Disposable Income and Inequality UK 2019/20, table 14) by the regional gross disposable household income, also provided by the ONS (ONS 2020 regional gross disposable household income). These income amounts are then increased to the level they would be at in April 2020 had they risen in line with inflation, and they are assumed to continue to rise in line with UK-level inflation throughout the modelled period.
For the UC component of household income, we have used the published standard allowances for 2020-21 and 2021-22. The amounts are fixed for the duration of each financial year. For simplicity, the extra amount per child is the same for each child.
Table 5.1: UC standard allowance and per-child payment
| Monthly allowance | 2020-21 uplifted |
2020-21 without uplift |
2021-22 uplifted |
2021-22 without uplift |
|---|---|---|---|---|
| Single and under 25 | £342.72 | £256.05 | £344.00 | £257.33 |
| Single and over 25 | £409.89 | £323.22 | £411.51 | £324.84 |
| A couple 25 or over (covering both) |
£594.04 | £507.37 | £596.58 | £509.91 |
| Extra for each child | N/A | £235.83 | N/A | £237.08 |
Source: 2020-21: House of Commons Library (2020) “Benefits Uprating 2020”. 2021-22: UK Government “Universal Credit”. The 2021-22 UC without uplift is estimated by reducing the published uplifted amount by the monthly equivalent of not receiving the extra £20 per week for 52 weeks.
Expenditure
The regional expenditure of the households is informed by the ONS “Family Spending” workbooks. Expenditure data for the lowest income decile is used for single-parent households, and expenditure data for the second lowest income decile is used for two-parent households. Household expenditure of the relevant gross income decile provided at the UK level is used to scale the regional average expenditure figures. This provides approximate figures of the expenditure on different items of the relevant income decile in each region of the UK. Expenditure is assumed to increase in line with inflation.
Data on the households’ monthly rent is collected from various sources. For regions of England, ONS data provide lower quartile monthly rents of two bedroom properties.
For Scotland and Wales, the respective governments provide mean and lower quartile (respectively) monthly rent for two bedroom properties. For Northern Ireland, the Assembly provides average rents for apartments and semi-detached properties. We have assumed that all of the households are in private rented accommodation, as we consider that this would imply a more precarious situation than being in council housing (and therefore a better reflection of the most vulnerable type of household).
We assume that each household’s expenditure remains fixed at the above levels (apart from increases due to inflation). Thus, our model considers the extent to which policy support mechanisms assist households in meeting the approximate typical expenditure of the lowest income decile households in each region.
|
Household number |
Financial resilience of family |
Household composition |
Pre-pandemic employment status |
Pandemic employment status |
Housing |
Cash savings at start of crisis |
Debt at start of crisis (excluding mortgage) |
|---|---|---|---|---|---|---|---|
|
1 |
Low |
Single parent with two children |
UC |
UC |
Renting from private landlord |
None |
Rent arrears of three months' rent. Additional debt of £1,500 |
|
2 |
Low |
Two parents with two children |
One adult in precarious work, other not in workforce (no childcare costs) |
UC |
Renting from private landlord |
None |
Rent arrears of three months' rent |
|
3 |
Medium |
Single parent with two children |
Low income and receiving UC |
UC |
Renting from private landlord |
None |
None |
|
4 |
Medium |
Two parents with two children |
One adult in work, other in low-income work, both receiving UC |
UC |
Renting from private landlord |
None |
None |
|
5 |
High |
Single parent with two children |
Employed full-time |
UC |
Renting from private landlord |
£5,000 (below UC threshold £16,000) |
None |
|
6 |
High |
Two parents with two children |
Both employed full-time |
One parent remains employed, other unemployed, and both on UC |
Renting from private landlord |
£12,000 (below UC threshold £16,000) |
None |
We note that our modelling focuses on households which were already on relatively low incomes prior to the pandemic, which is reflected in the use of expenditure data for the lowest income deciles and the use of lower quartile rents (where the relevant data are available). However, one effect of the pandemic has been that some people who were previously on higher incomes (and who may therefore have spending commitments reflecting their previous incomes, such as higher rent payments) have become newly unemployed and dependent on UC. Further modelling would be required to assess the effect of the withdrawal of support measures on the finances of such households.
Our modelling also focuses only on households in rented accommodation. Further modelling would be needed to analyse the effect of the withdrawal of support measures on households affected by the pandemic who are paying mortgages on owner-occupied housing.
Finally, further modelling would also be needed to analyse the finances of households in which income earners have been on furlough during the pandemic, and which face the prospect of being made unemployed, and becoming dependent on UC, when the furlough scheme comes to an end.
Policy support mechanisms and assumptions
We have modelled the impact of the following policy support mechanisms on the finances of stylised households. No other means of financial support is assumed.
- Universal Credit (UC), including the uplift to the standard allowance, plus the associated Local Housing Allowance (LHA)
- Discretionary Housing Payments (DHP)
- The Winter Grant Scheme’s payments of three weeks of food expenditure per child
- Zero-interest loans (announced in the recent Budget).
We now summarise the main assumptions we have made.
The Universal Credit uplift
As stated above, we have assumed that the households that receive Universal Credit (UC) – before the crisis and/or because of it – receive the relevant standard allowance plus the additional amount for children. These households are assumed to receive the weekly allowance uplift which came into effect on 6 April 2020. We have modelled the impact of withdrawing this uplift at the end of September 2021.
Since the amount of UC a household can receive depends on the household’s composition, some assumptions are required. We have assumed that one of the ‘low resilience’ households is single and under 25 (leaving it with the lowest standard allowance), and that the other households comprise singles and couples over 25. We assume two children per household, with the households receiving an additional amount for each child.
Under the UC scheme, the Housing Element enables an additional payment to be made to help households cover rent payments to their landlord. In the private rented sector, the Housing Element is capped at the relevant limit for a given household based on its characteristics, called the Local Housing Allowance (LHA). The payment amount varies widely by council area and depends on factors such as household size and age, the number of bedrooms for which a claimant is eligible for, and the broad rental market area (BRMA). We have used the NUTS1 regional average of published LHA rates effective from 1 April 2020. For the regions of England, the rates selected are those corresponding to situations where tenant has the use of only two bedrooms (Category C). For Scotland, Wales and NI, the rates of two-bedroom properties are used.
We assume that a household can access the Housing Element of UC up to the estimated capped amount of LHA in a given month. In response to the pandemic the LHA rates were uplifted to the 30th percentile of market rents and we assume that the uplift remains throughout the modelled period.
Several other factors also limit the total amount of UC payments a household can receive in a given month:
- UC payments are reduced by £0.63 for every £1 of salaried income after-tax above the relevant work allowance. The work allowance enables households to receive a certain amount of income before UC starts being scaled back. The allowance is higher for households that are not in receipt of the Housing Element (whose allowance is £515) than for those whose rent payments are supported by the Housing Element (£293).
- UC payments are reduced when a household’s level of savings exceeds £6,000. Every £250 of savings above £6,000 is treated as providing a monthly income of £4.35, which is then deducted from UC. If savings exceed £16,000, the household is no longer entitled to UC. (Parts of £250 are also included in the calculation. For example, savings of £6,001 or £6,250 would both cause UC to be decreased by £4.35)
- the Benefit Cap limits the amount of benefit a household can receive after the nine-month ‘grace period’ has ended. The cap is higher for households in London than for households in other regions: £1,917 monthly versus £1,667 monthly.
The households in receipt of UC in our model are assumed to not be using childcare, not to be caring for someone, and not to be out of work because of sickness/disability. Furthermore, none of our stylised households get the severe disability premium. These assumptions mean that the households do not receive additional amounts other than those discussed above for children and housing.
Discretionary Housing Payments
Discretionary Housing Payments (DHP) can help households on UC meet their housing costs, where the Housing Element of UC does not cover households’ full rent. Data from the LGA survey show (for responding councils) the total number of DHP awards and total council spending on DHP by financial quarter. As the responding councils do not cover all regions, the regional figures are incomplete, and the number of responding councils in some regions that are represented is also low. We therefore rely on the average DHP award in England and scale it to reflect regional differences in rental costs (as given by the ONS in its “Family Spending” workbooks). We assume that a household in a given region receives up to the regional amount to cover housing costs that are not met by the UC Housing Element. (We note that DHP payments are often awarded strictly to the most vulnerable households and are not guaranteed in the instance that UC payments cannot meet a household’s rent liabilities. Since we are modelling households assumed to be in the lowest two income deciles, we assume that a household meets vulnerability criteria and thus can receive DHP after receiving UC and the Housing Element, if needed)
Local welfare schemes funded by Winter Grant Scheme
In 2020, the Department for Work and Pensions introduced the Winter Grant Scheme (WGS) to help households meet other living expenses. The WGS required that at least 80 per cent of the grant was allocated to the provision of support with food, energy costs (for heating, lighting, and cooking) and water costs (DWP (2020) “COVID Winter Grant Scheme determination: December 2020 to March 2021”). The first WGS was in place until the end of March 2021.
The responses to the LGA survey indicate that the funds were used mostly for the “provision of cash payments to residents for food and other essentials”, but they do not provide figures for actual monetary amounts given per household. In our model, we have assumed that the households can receive up to three weeks of food expenditure per child to cover the period that cannot be met by the income of households with children during the Christmas 2020 break and February 2021 half-term (an assumption based on the support provided by many councils). For example, Hillingdon Council provided £15 per child per week for food for households with children under 19 for three weeks over the Christmas and February school holidays in 2020-2021; Cheshire East Council provided £20 per week per child; Essex provided meal vouchers for eligible children during the Christmas holiday and February half term; Westminster City Council provided £15 per child during February 2021 half term).
The amount is assumed to be £15 per child per week at the UK level, scaled to reflect regional differences in food expenditure, to arrive at regional maximum amount per child.
Zero-interest loans
In the spring 2021 Budget, the government stated that it will provide up to £3.8 million of funding for a pilot of a no-interest loans scheme, to give vulnerable consumers an alternative to high-cost credit. Given the scarcity of details of this policy, we have assumed a maximum value for the zero-interest loan that a household can apply for. The maximum amount is set at three times the rent in a given region. While this loan amount will add to total household debt, the household does not then accumulate further debt from interest on the principal amount. We assume that households can access zero-interest loans from April 2021.
Assumed sequence of incomings and outgoings
The modelling approach has assumed the following sequence of cash incomings and outgoings:
- At the beginning of month, a household receives income (UC plus any salary income). A household is assumed to receive the Housing Element of UC up to the limit of the household’s monthly rent or the relevant LHA cap, whichever is lower. Where applicable, the total UC received is reduced to take account of any other household income and/or any household savings. It is also constrained by the Benefit Cap, which limits the total amount of UC (the standard allowance plus LHA and child element) that households can receive.
- The household may also have some savings or debt.
- The household uses income in (1), savings in (2) to meet monthly expenditure:
- First, the household tries to meet food expenditure with income. If it is insufficient, then savings are used.
- Second, the household tries to meet the remaining expenditure (clothing, household goods, transport etc.) with income. If it is insufficient, then savings are used.
- If any of the expenditure items (3)(a) to (3)(b) cannot be met in full by income or savings, the household can then claim any further policy support available to it in that month:
- DHP might cover the housing payments that the Housing Element of UC or savings do not meet up to the limit of the scaled average DHP award (described above).
- If the months that fall between December 2020 and March 2021, the household can claim three weeks of food expenditure per child with WGS payments to meet outstanding food expenditure, up to a cap of £15 per child per week scaled according to regional food expenditure.
- If the month is April 2021 or after, the household can access zero interest loans to cover remaining outstanding expenditure up to the defined limit.
- Any outstanding expenditure which cannot be met in full by the policy support, becomes standard, interest-bearing debt. The interest on previous debt, assumed to be 8 per cent per month (broadly based on the monthly interest rate on a personal loan of up to £5,000 during 2020 from the Bank of England’s Bankstats tables, table G1.3 - "average quoted household interest rates"), is added to the outstanding amount. (For the purpose of our modelling, we assume that the household takes out debt if necessary, to cover its rental payments. However, we recognise that in practice some struggling households might accumulate rental arrears and have less other debt. For instance, this might happen in cases where households where unable to access credit, or in the social housing sector where there is a low likelihood of eviction for rent arrears, even after the eviction ban was lifted. Further modelling would be required to analyse the finances of households that built up greater rent arrears rather than taking out other debt.)
- Any outstanding rent is added to the household’s total rent arrears, which accumulates monthly interest based on the maximum annual arrears fees permitted by the Tenant Fees Act 2019: 3 per cent of outstanding rent arrears plus the Bank of England’s base rate, which is currently 0.1 per cent.
- If the household’s income exceeds expenditure (before any of the policy support mechanisms), the surplus is used to pay down any outstanding debt. If debt is zero, then the surplus becomes savings.
Results and discussions
Figure 5.1 below shows the UK average net cash inflow of households before interest each month between April 2020 and December 2021. This includes UC payments (including the child and housing elements) plus any salaried income on the inflow side, and monthly expenditure on goods and services on the outflow side. It does not show the impact of any interest due on debt or fees in the case of rent arrears.
During the period in which the UC uplift is in place, most stylised households (1-5) can meet their assumed monthly expenditure and retain a small surplus which can be used to pay debt and/or rent arrears, or to accumulate savings. After October 2021, when the uplift is withdrawn, the model suggests that these households would in consequence be unable to meet their monthly expenditure and would have to deplete savings or take out loans.
In contrast, household 6, which receives salaried income and UC (reduced based on income and prior savings), has a surplus at the beginning of the period. This falls over time due to higher UC savings deductions as its savings accumulate, until December 2020 when it reaches the £16,000 savings threshold for UC eligibility and consequently no longer entitled to UC. Household 6 – the most financially resilient of our stylised households – is therefore able to accumulate some savings whilst on UC but must use these savings in the months when UC is not received to meet the costs of rent. This dynamic brings the household’s savings back below the UC eligibility threshold. This illustrates the problems that could arise with the sudden withdrawal of UC when the threshold of £16,000 savings is passed. (It may not always be the case that a household is able to switch in and out of eligibility for UC on a monthly basis. So, for some households, the effect demonstrated in Figure 5.1 could incentivise such a household not to allow their savings to rise above £16,000 to ensure they do not lose their eligibility for UC).
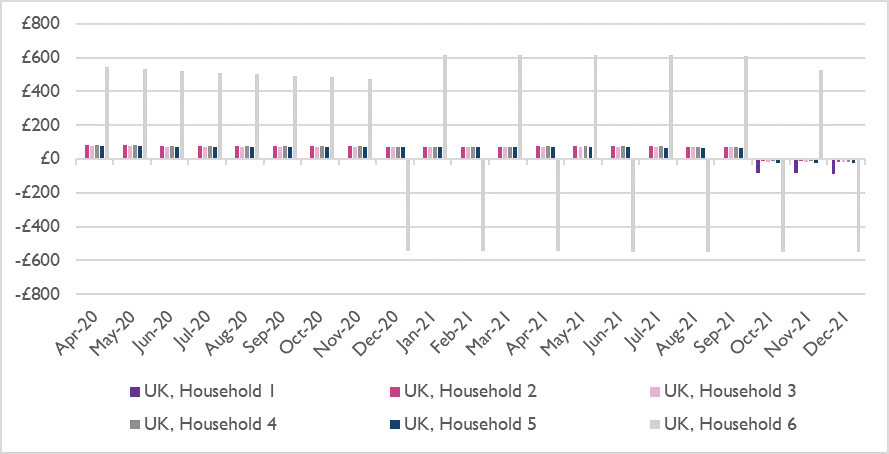
Source: Europe Economics analysis.
Further information on the dynamics of the finances of the least financially resilient households over the modelled period can be seen by locking at the stock of debt or savings that each household has. Figure 5.2, below, suggests that household 1, which entered the crisis with £1,500 debt, and three months of rent arrears, finds itself in a situation of rapidly multiplying debt over the period. This is driven by the interest accumulating on the initial amount of debt, which exceeds the small cash surplus the household has each month. When the UC uplift is stopped at the end of September 2021 and the household’s surplus disappears, it is no longer able to pay off any debt or arrears, and the amount it is required to borrow increases. At this point, the household can access zero-interest loans to reduce the dependency on commercial loans somewhat. In London, where living costs are higher than the UK average, even the moderately resilient household 4 becomes increasingly reliant on debt towards the end of the period (see Figure 5.3).
Further information on the dynamics of the finances of the least financially resilient households over the modelled period can be seen by looking at the stock of debt or savings that each household has. Figure 5.2 below suggests that household 1, which entered the crisis with £1,500 debt and three months of rent arrears, finds itself in a situation of rapidly multiplying debt over the period. This is driven by the interest accumulating on the initial amount of debt, which exceeds the small cash surplus the household has each month. When the UC uplift is stopped at the end of September 2021 and the household’s surplus disappears, it is no longer able to pay off any debt or arrears, and the amount it is required to borrow increases. At this point, the household can access zero-interest loans to reduce some of the dependency on commercial loans. In London, where living costs are higher than the UK average, even the moderately resilient household 4 becomes increasingly reliant on debt towards the end of the period (see Figure 5.3).
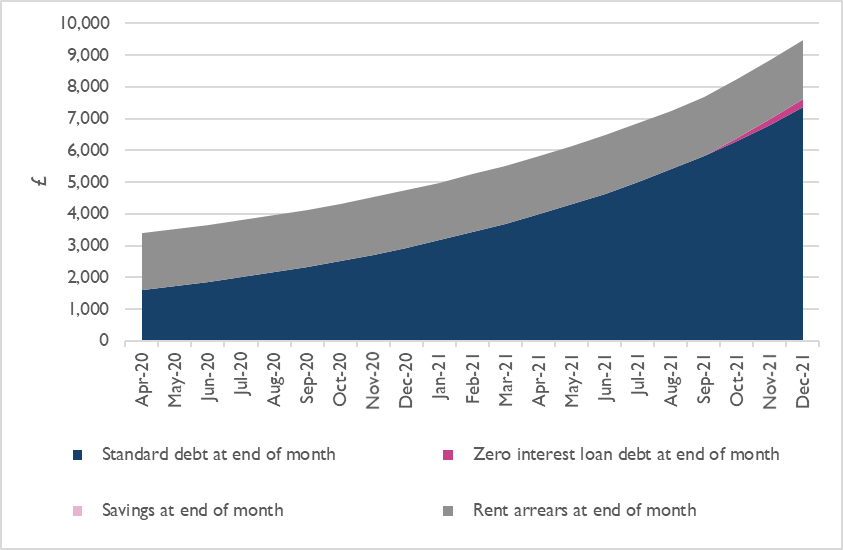
Source: Europe Economics analysis.
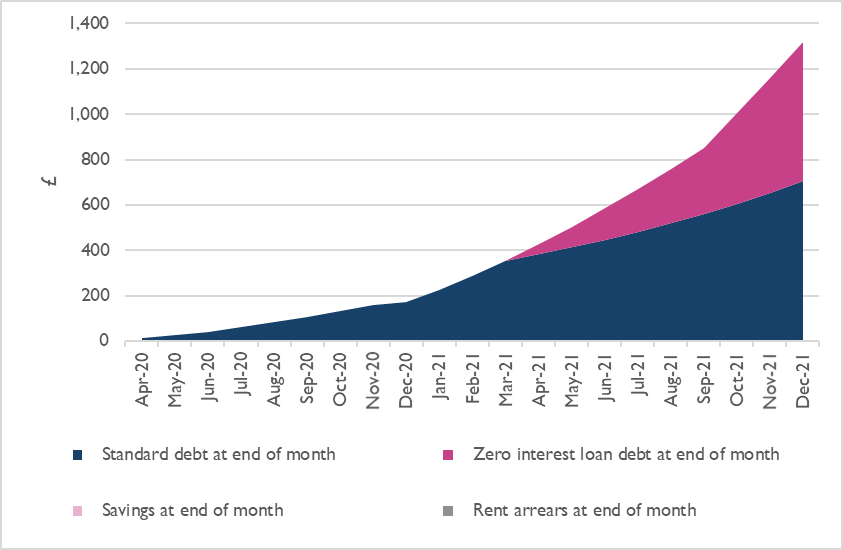
Source: Europe Economics analysis.
In contrast to the UK average for household 1, household 2 (shown in Figure 5.4, below) is able to reduce its initial rent arrears to below one month’s rent over the period in which the UC uplift is in place. This progress is halted by the end of the uplift, leaving the household unable to repay its arrears and to begin to require zero-interest loans to meet its outstanding expenditures. The interest on outstanding rent arrears, can then be seen increasing the amount that the household is liable to pay.
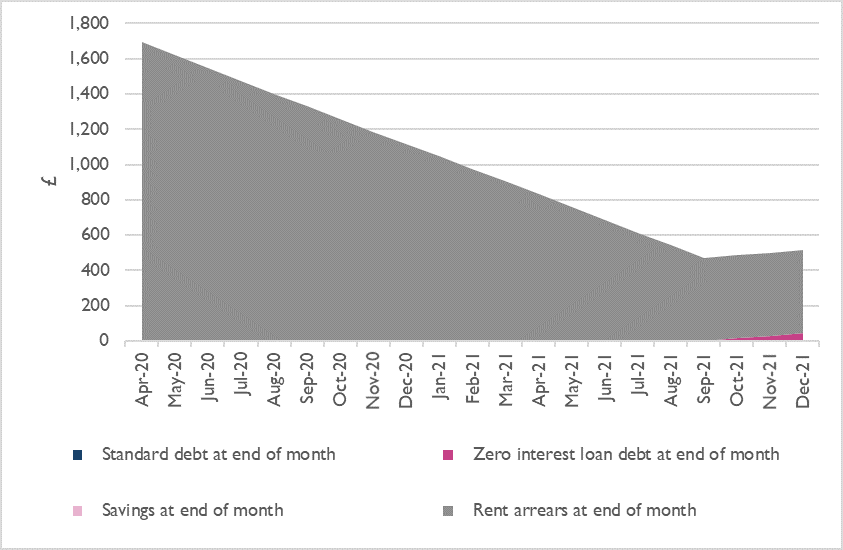
Source: Europe Economics analysis.
For some households, the Benefit Cap affects the ability of the household to meet outgoing payments. For example, household 4 in the East of England received salaried income before the pandemic but moved onto UC during the crisis period (see Figure 5.5, below). This means that it benefited from the ‘grace period’, during which UC payments were not limited by the Benefit Cap, enabling the household to retain a small cash surplus each month. After nine months, however, the Benefit Cap is introduced, and this causes the small surplus to become a small deficit. The deficit increases upon the withdrawal of the UC uplift in October 2021.
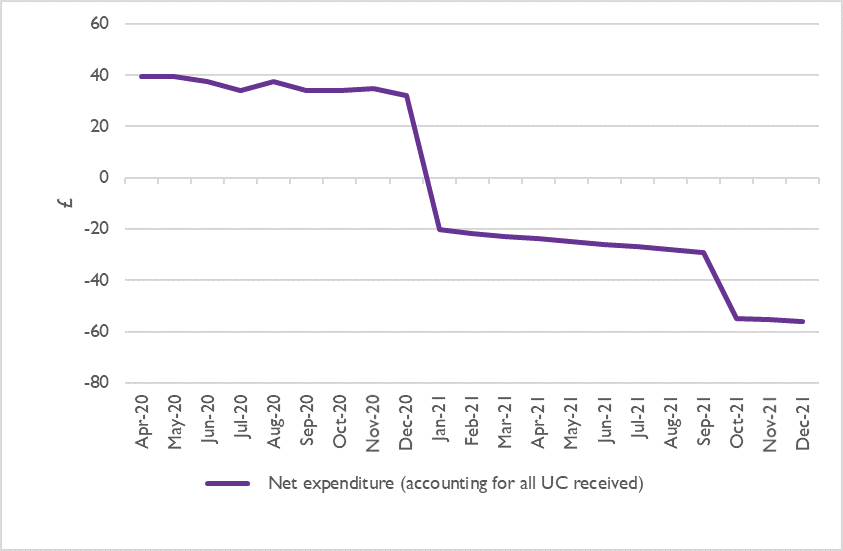
Source: Europe Economics analysis.
The cumulative stocks of debt and savings of all households can be seen in Figure 5.6. This shows the increasing debt of household 1, the gradual accumulation of small amounts of savings by households 3 and 4, and the increasing savings of households 5 and 6 from their initial levels. The small amount of debt accumulated by household 2 is not visible at this scale but may be seen in Table 5.3.
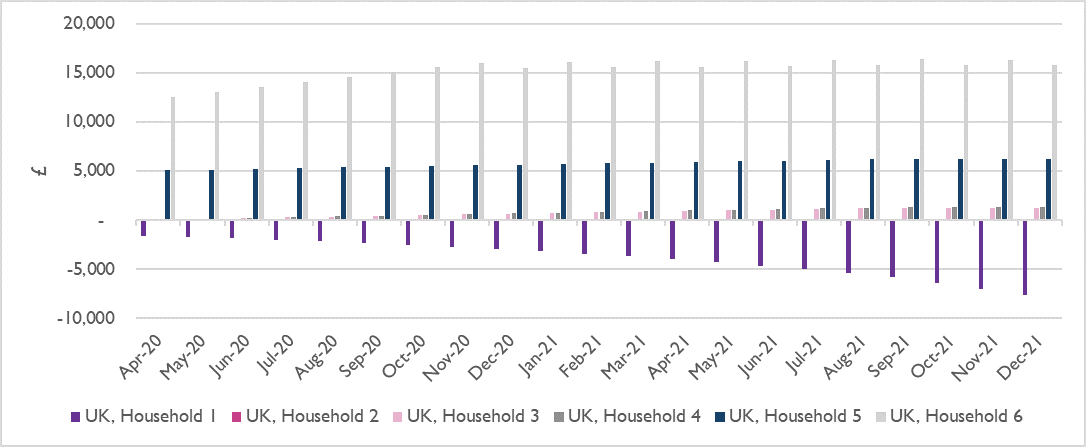
Source: Europe Economics analysis.
|
Region, Household |
Rent arrears |
Other debt |
|---|---|---|
|
UK, 1 |
1,869 |
7,611 |
|
England, 1 |
1,742 |
8,383 |
|
North East, 1 |
1,267 |
2,832 |
|
North West, 1 |
1,504 |
4,418 |
|
Yorkshire and The Humber, 1 |
1,504 |
4,582 |
|
East Midlands, 1 |
1,663 |
7,282 |
|
West Midlands, 1 |
1,742 |
4,004 |
|
East, 1 |
2,059 |
9,123 |
|
London, 1 |
3,959 |
10,956 |
|
South East, 1 |
2,518 |
14,974 |
|
South West, 1 |
2,027 |
9,670 |
|
Wales, 1 |
1,425 |
3,450 |
|
Scotland, 1 |
1,517 |
3,464 |
|
Northern Ireland, 1 |
1,372 |
2,860 |
|
Region, Household |
Rent arrears |
Other debt |
|---|---|---|
|
UK, 2 |
473 |
44 |
|
England, 2 |
738 |
107 |
|
North East, 2 |
- |
- |
|
North West, 2 |
- |
- |
|
Yorkshire and The Humber, 2 |
- |
- |
|
East Midlands, 2 |
104 |
17 |
|
West Midlands, 2 |
- |
- |
|
East, 2 |
1,414 |
166 |
|
London, 2 |
1,908 |
3,650 |
|
South East, 2 |
2,518 |
5,807 |
|
South West, 2 |
1,707 |
219 |
|
Wales, 2 |
- |
- |
|
Scotland, 2 |
- |
- |
|
Northern Ireland, 2 |
- |
- |
|
Region, Household |
Rent arrears |
Other debt |
|
UK, 3 |
- |
- |
|
England, 3 |
- |
- |
|
North East, 3 |
- |
- |
|
North West, 3 |
- |
- |
|
Yorkshire and The Humber, 3 |
- |
- |
|
East Midlands, 3 |
- |
- |
|
West Midlands, 3 |
- |
- |
|
East, 3 |
- |
- |
|
London, 3 |
- |
455 |
|
South East, 3 |
- |
4,282 |
|
South West, 3 |
- |
144 |
|
Wales, 3 |
- |
- |
|
Scotland, 3 |
- |
- |
|
Northern Ireland, 3 |
- |
- |
|
Region, Household |
Rent arrears |
Other debt |
|
UK, 4 |
- |
- |
|
England, 4 |
- |
- |
|
North East, 4 |
- |
- |
|
North West, 4 |
- |
- |
|
Yorkshire and The Humber, 4 |
- |
- |
|
East Midlands, 4 |
- |
- |
|
West Midlands, 4 |
- |
- |
|
East, 4 |
- |
66 |
|
London, 4 |
- |
3,650 |
|
South East, 4 |
- |
5,807 |
|
South West, 4 |
- |
219 |
|
Wales, 4 |
- |
- |
|
Scotland, 4 |
- |
- |
|
Northern Ireland, 4 |
- |
- |
|
Region, Household |
Rent arrears |
Other debt |
|
UK, 5 |
- |
- |
|
England, 5 |
- |
- |
|
North East, 5 |
- |
- |
|
North West, 5 |
- |
- |
|
Yorkshire and The Humber, 5 |
- |
- |
|
East Midlands, 5 |
- |
- |
|
West Midlands, 5 |
- |
- |
|
East, 5 |
- |
- |
|
London, 5 |
- |
- |
|
South East, 5 |
- |
- |
|
South West, 5 |
- |
- |
|
Wales, 5 |
- |
- |
|
Scotland, 5 |
- |
- |
|
Northern Ireland, 5 |
- |
- |
|
Region, Household |
Rent arrears |
Other debt |
|
UK, 6 |
- |
- |
|
England, 6 |
- |
- |
|
North East, 6 |
- |
- |
|
North West, 6 |
- |
- |
|
Yorkshire and The Humber, 6 |
- |
- |
|
East Midlands, 6 |
- |
- |
|
West Midlands, 6 |
- |
- |
|
East, 6 |
- |
- |
|
London, 6 |
- |
- |
|
South East, 6 |
- |
- |
|
South West, 6 |
- |
- |
|
Wales, 6 |
- |
- |
|
Scotland, 6 |
- |
- |
|
Northern Ireland, 6 |
- |
- |
Source: Europe Economics analysis.
These results generally show that the least financially resilient household, 1, ends the period with at least as much debt as it started with, and is unable to repay its rent arrears. Households in regions with higher living expenses, such as London, South East, South West and the East, tend to accumulate a higher degree of debt, whereas households with similar characteristics in other regions manage to avoid it entirely. Both the England and UK average household 2 are unable to fully pay their arrears. Households 5 and 6 are able to avoid entering debt over the period.
The Housing Element of UC is important in helping the households meet rent costs. The UC LHA cap, coupled with the Benefit Cap, is generally high enough to help households meet their outstanding rent, to the extent that the DHP is rarely required to meet the remaining sum. However, these limits are reached in regions with high rents (London and South East), such that relatively high proportions of rent costs are not covered by UC in such regions and must be met by savings (where available) or DHP.
Limitations
Our modelling approach assumes that the levels and distribution of expenditure do not change throughout the period for reasons other than inflation. During the COVID-19 pandemic, there have been multiple opportunities for expenditure patterns to change. For example, expenditure on transport and outdoors entertainment, retail and accommodation has been limited by lockdowns, whilst expenditure on domestic energy costs have increased for many as people spend more time at home. However, abstracting away such expenditure changes means that the model has value in demonstrating the financial position of households seeking to maintain a relatively low standard of living, based on expenditure data compiled by the ONS on the most vulnerable households in society.
The model makes assumptions about the behaviour of households that face both increasing debt and rent arrears. In such a situation, we assume that a household prioritises the payment of rent as it falls due each month – and does so through accessing further credit if necessary. This could be realistic if the household faced the risk of eviction but may not always have characterised behaviour during the crisis given the government’s ban on evictions. At the same time, the model assumes that paying off other debt takes priority over repaying any historical rent arrears (which might perhaps be driven by the cap on the interest rate that landlords are permitted to charge on rent arrears).
The assumed level of income for household 6, in addition to the UC it receives, enables it to meet its expenditure each month and to accumulate surplus income until its savings reach the threshold level of eligibility for UC (see Figure 5.6). This precipitates a cycle in which its savings pass the threshold, and it loses UC, thus requiring the household to use its savings to fund expenditure until its savings fall back below the eligibility threshold and it becomes eligible for UC again. It is perhaps unlikely that a household would cycle in and out of the pool of UC claimants in this manner – for example, such a household might make sure its savings did not pass the threshold to ensure it did not lose its UC entitlement. Nonetheless, the modelling has value in demonstrating the issues that potentially arise when such a household nears the £16,000 savings threshold.
Potential further research
Our modelling of the finances of stylised households could usefully be extended in future research to cover the following:
- The impact of the withdrawal of support measures on households that previously had a higher income (and which therefore have spending commitments which reflect their previous income e.g. higher rent payments), but which have become newly dependent on UC as a result of the pandemic. (This could include modelling to investigate how long a household with the average level of savings will be able to rely on drawing down its savings before getting into financial difficulty.)
- The impact of the withdrawal of the furlough scheme at the end of September 2021 on households in which income earners have been on furlough during the pandemic and become unemployed when the furlough scheme ends.
- The impact of the withdrawal of support measures (including mortgage payment holidays) on households which have a mortgage, and which have been hit financially by the pandemic.
- The effect on the accumulation of rent arrears and other debt if households do not take out additional credit to pay their rent, but instead accumulate rent arrears. (This kind of behaviour may be more typical in the social housing sector, given the low likelihood of eviction for rent arrears in since the ban on rental evictions has been lifted.)
6. Conclusions
In this report, we set out the key mechanisms in place at both national and local levels to support economically vulnerable households through the COVID-19 crisis, and present modelling results of potential impact of the removal of these support mechanisms.
National support mechanisms
At national level, key support mechanisms are as follows:
- policies to support the incomes of those in employment, namely the Coronavirus Job Retention Scheme (commonly called the furlough scheme) and the Self-employment Income Support Scheme (SEISS)
- Universal Credit, which provides a safety net for those who have no income or low incomes. In response to the crisis, the government uplifted the standard allowance and the maximum Local Housing Allowance and relaxed the assessment rules for self-employed people
- payment holidays on debt, namely mortgage payment holidays and payment holidays on loans and credit cards
- a temporary ban on the eviction of renters
- other national support measures, such as the option to defer self-assessment payment on account and a pilot of a no-interest loans scheme.
The figure below shows the announced end dates of these various support mechanisms.
Local support mechanisms
Local authorities have also been at the forefront of providing support to economically vulnerable households through the crisis. While the support by councils has varied, responses by a number of councils to an LGA survey suggest that councils have supported economically vulnerable households in the following ways:
- assisted households struggling to pay council tax bills. This has been done through pre-existing Council Tax Reduction Schemes, additional council tax relief funded by the government’s COVID-19 hardship fund, the provision of alternative payment arrangements, and lighter touch approaches to enforcement.
- assisted households with housing needs. Councils typically appear to have spent more providing temporary accommodation for homeless people, as well as spending more on Discretionary Housing Payments, to assist residents struggling to pay their rent.
- assisted households with a range of other needs. This has included providing greater support through Local Welfare Assistance schemes, the provision of food and other essentials from the funding provided by the government’s Emergency Assistance Grant for Food and Essential Supplies, enhanced support through the winter from funding under the COVID Winter Grant Scheme, and the provision of a greater number of free school meals. Councils may also be providing greater support in the areas of debt advice, support with mental health, and assistance with job finding or training for new roles.
Regional unemployment projections
To understand the potential impact on unemployment in different regions when the furlough scheme comes to an end on 30 September 2021, we considered three COVID-19 scenarios. In our short scenario, the vaccination programme is a success and there is limited economic scarring. In our medium scenario, the vaccination programme is also successful, but there is a greater degree of economic scarring from the crisis. In our extended scenario, there is another lockdown towards the end of 2021 (e.g. due to a new coronavirus variant), leading to another drop in economic output and greater economic scarring thereafter.
The main findings from our scenario modelling are:
- the UK unemployment rate immediately after the furlough scheme ends at the end of September 2021 could range between 5.1 and 6.8 per cent
- in the event that there is a third wave of infections in Autumn 2021 (e.g. due to a new strain of the virus) and a subsequent lockdown, the unemployment rate could rise – without the resumption of the furlough scheme and absent any other support measures – to nearly 15 per cent
- depending on the extent of economic scarring caused by over a year of below-trend economic output, the unemployment rate could return to the pre-pandemic level either by the beginning of 2022 or in several years’ time
- the modelled unemployment rate in our central (medium) scenario is slightly more optimistic than the recent projections of the OBR and the Bank of England
- the projected unemployment in our scenarios varies by region, with the highest unemployment rate once the furlough scheme ends being in the North East of England
Impact on Finances of Stylised Economically Vulnerable Households
We modelled the potential impact of selected support mechanisms on the finances of economically vulnerable households. The support mechanisms we considered were Universal Credit (including the uplift to standard allowances), Discretionary Housing Payments, support with food expenditure from the Winter Grant Scheme, and zero-interest loans. We considered the impact on stylised households with low, medium, and high financial resilience, in each case considering stylised one-parent and two-parent households. We took account of regional variations in household expenditure and LHA rates in our modelling.
Key findings from this modelling are as follows:
- during the period in which the £20 per week uplift to the UC standard allowance is in place, the majority of our stylised households are able to meet their monthly expenditure. However, the end of this uplift causes financial difficulties for some of our stylised households
- our stylised households are more likely to get into debt in parts of the country where the cost of living is higher, given that the UC standard allowance and the additional UC amount for children are the same nationwide. Further, the government’s benefit cap may cause financial difficulties for stylised households in areas where rental costs are higher
- economically vulnerable households which start off with significant debt are at risk of entering a debt spiral, where debt increases to unsustainable levels due to the household’s inability to pay the interest on their debt
- a zero-interest loans scheme may slow down the accumulation of debt by struggling households but does not deal with the underlying problem of household income being insufficient to cover expenditure.
Future research could usefully extend the modelling to consider higher income households which have become newly dependent on UC, households affected by the pandemic which are paying mortgages rather than rent, and households where income earners are on furlough and become unemployed when the furlough scheme ends. The modelling could also be extended to consider households which build up rent arrears rather than taking out other debt.
Appendix 1: Unemployment Projections
OBR forecast unemployment rate
The OBR expects unemployment to peak at 6.5 per cent in the final quarter of 2021, once the furlough scheme has closed. The OBR suggests that unemployment will rise once the furlough scheme closes due to a persisting shortfall in output relative to the pre-COVID-19 path (GDP is expected to be 5.0 per cent below the OBR’s previous March 2020 forecast at the point the furlough scheme closes, with employment down 3.1 per cent).
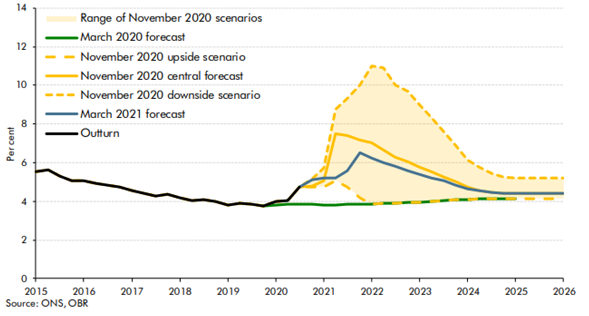
NUTS 2 unemployment rates
|
Country / Region |
Sep-21 |
Oct-21 |
Nov-21 |
Dec-21 |
Jan-22 |
Feb-22 |
Mar-22 |
Apr-22 |
|
Tees Valley and Durham |
6.2 |
7.0 |
6.5 |
6.0 |
6.0 |
6.0 |
6.0 |
6.0 |
|
Northumberland and Tyne and Wear |
5.8 |
6.7 |
6.2 |
5.6 |
5.6 |
5.6 |
5.6 |
5.6 |
|
Cumbria |
2.8 |
3.8 |
3.1 |
2.4 |
2.4 |
2.4 |
2.4 |
2.4 |
|
Greater Manchester |
5.2 |
6.1 |
5.6 |
5.0 |
5.0 |
5.0 |
5.0 |
5.0 |
|
Lancashire |
3.5 |
4.4 |
3.9 |
3.3 |
3.3 |
3.3 |
3.3 |
3.3 |
|
Cheshire |
3.6 |
4.5 |
4.0 |
3.4 |
3.4 |
3.4 |
3.4 |
3.4 |
|
Merseyside |
4.2 |
5.1 |
4.6 |
4.1 |
4.1 |
4.1 |
4.1 |
4.1 |
|
East Yorkshire and Northern Lincolnshire |
5.5 |
6.3 |
5.7 |
5.2 |
5.2 |
5.2 |
5.2 |
5.2 |
|
North Yorkshire |
2.4 |
3.4 |
2.7 |
2.0 |
2.0 |
2.0 |
2.0 |
2.0 |
|
South Yorkshire |
5.6 |
6.3 |
5.8 |
5.2 |
5.2 |
5.2 |
5.2 |
5.2 |
|
West Yorkshire |
4.7 |
5.6 |
5.0 |
4.5 |
4.5 |
4.5 |
4.5 |
4.5 |
|
Derbyshire and Nottinghamshire |
4.2 |
5.1 |
4.6 |
4.0 |
4.0 |
4.0 |
4.0 |
4.0 |
|
Leicestershire, Rutland and Northamptonshire |
3.8 |
4.7 |
4.1 |
3.6 |
3.6 |
3.6 |
3.6 |
3.6 |
|
Lincolnshire |
3.8 |
4.6 |
4.0 |
3.4 |
3.4 |
3.4 |
3.4 |
3.4 |
|
Herefordshire, Worcestershire and Warwickshire |
3.0 |
3.9 |
3.3 |
2.8 |
2.8 |
2.8 |
2.8 |
2.8 |
|
Shropshire and Staffordshire |
3.5 |
4.5 |
3.9 |
3.3 |
3.3 |
3.3 |
3.3 |
3.3 |
|
West Midlands |
6.9 |
7.8 |
7.2 |
6.6 |
6.6 |
6.6 |
6.6 |
6.6 |
|
East Anglia |
3.5 |
4.4 |
3.8 |
3.2 |
3.2 |
3.2 |
3.2 |
3.2 |
|
Bedfordshire and Hertfordshire |
3.4 |
4.4 |
3.9 |
3.3 |
3.3 |
3.3 |
3.3 |
3.3 |
|
Essex |
3.4 |
4.3 |
3.7 |
3.2 |
3.2 |
3.2 |
3.2 |
3.2 |
|
Inner London - West |
4.8 |
5.9 |
5.3 |
4.7 |
4.7 |
4.7 |
4.7 |
4.7 |
|
Inner London - East |
4.6 |
5.6 |
5.0 |
4.4 |
4.4 |
4.4 |
4.4 |
4.4 |
|
Outer London - East and North East |
5.7 |
6.6 |
6.0 |
5.4 |
5.4 |
5.4 |
5.4 |
5.4 |
|
Outer London - South |
3.8 |
4.8 |
4.2 |
3.6 |
3.6 |
3.6 |
3.6 |
3.6 |
|
Outer London - West and North West |
4.8 |
5.9 |
5.3 |
4.6 |
4.6 |
4.6 |
4.6 |
4.6 |
|
Berkshire, Buckinghamshire and Oxfordshire |
2.8 |
3.8 |
3.3 |
2.7 |
2.7 |
2.7 |
2.7 |
2.7 |
|
Surrey, East and West Sussex |
2.9 |
4.0 |
3.3 |
2.7 |
2.7 |
2.7 |
2.7 |
2.7 |
|
Hampshire and Isle of Wight |
3.5 |
4.5 |
3.9 |
3.3 |
3.3 |
3.3 |
3.3 |
3.3 |
|
Kent |
4.1 |
4.9 |
4.3 |
3.7 |
3.7 |
3.7 |
3.7 |
3.7 |
|
Gloucestershire, Wiltshire and Bath/Bristol area |
3.4 |
4.4 |
3.8 |
3.2 |
3.2 |
3.2 |
3.2 |
3.2 |
|
Dorset and Somerset |
2.8 |
3.7 |
3.1 |
2.5 |
2.5 |
2.5 |
2.5 |
2.5 |
|
Cornwall and Isles of Scilly |
3.7 |
4.8 |
4.0 |
3.2 |
3.2 |
3.2 |
3.2 |
3.2 |
|
Devon |
3.7 |
4.7 |
4.0 |
3.4 |
3.4 |
3.4 |
3.4 |
3.4 |
|
West Wales |
4.7 |
5.5 |
5.0 |
4.4 |
4.4 |
4.4 |
4.4 |
4.4 |
|
East Wales |
3.7 |
4.6 |
4.0 |
3.5 |
3.5 |
3.5 |
3.5 |
3.5 |
|
North Eastern Scotland |
3.3 |
4.1 |
3.5 |
2.9 |
2.9 |
2.9 |
2.9 |
2.9 |
|
Highlands and Islands |
2.9 |
3.8 |
3.2 |
2.5 |
2.5 |
2.5 |
2.5 |
2.5 |
|
Eastern Scotland |
3.5 |
4.4 |
3.8 |
3.2 |
3.2 |
3.2 |
3.2 |
3.2 |
|
West Central Scotland |
4.5 |
5.4 |
4.9 |
4.3 |
4.3 |
4.3 |
4.3 |
4.3 |
|
Southern Scotland |
3.5 |
4.4 |
3.8 |
3.3 |
3.3 |
3.3 |
3.3 |
3.3 |
|
Northern Ireland |
2.7 |
3.6 |
3.1 |
2.6 |
2.6 |
2.6 |
2.6 |
2.6 |
|
UK |
4.1 |
5.0 |
4.5 |
3.9 |
3.9 |
3.9 |
3.9 |
3.9 |
|
Country / Region |
Sep-21 |
Oct-21 |
Nov-21 |
Dec-21 |
Jan-22 |
Feb-22 |
Mar-22 |
Apr-22 |
|
Tees Valley and Durham |
6.4 |
8.3 |
8.1 |
8.0 |
7.8 |
7.6 |
7.5 |
7.3 |
|
Northumberland and Tyne and Wear |
5.9 |
8.2 |
8.0 |
7.8 |
7.6 |
7.5 |
7.3 |
7.1 |
|
Cumbria |
3.1 |
5.7 |
5.4 |
5.2 |
5.0 |
4.7 |
4.5 |
4.3 |
|
Greater Manchester |
5.3 |
7.6 |
7.5 |
7.3 |
7.1 |
6.9 |
6.7 |
6.5 |
|
Lancashire |
3.6 |
5.9 |
5.8 |
5.6 |
5.4 |
5.2 |
5.0 |
4.8 |
|
Cheshire |
3.7 |
6.0 |
5.8 |
5.6 |
5.5 |
5.3 |
5.1 |
4.9 |
|
Merseyside |
4.4 |
6.6 |
6.4 |
6.2 |
6.0 |
5.9 |
5.7 |
5.5 |
|
East Yorkshire and Northern Lincolnshire |
5.6 |
7.6 |
7.5 |
7.3 |
7.1 |
6.9 |
6.8 |
6.6 |
|
North Yorkshire |
2.6 |
5.2 |
5.0 |
4.8 |
4.5 |
4.3 |
4.1 |
3.8 |
|
South Yorkshire |
5.8 |
7.8 |
7.6 |
7.4 |
7.3 |
7.1 |
6.9 |
6.7 |
|
West Yorkshire |
4.8 |
7.0 |
6.8 |
6.6 |
6.5 |
6.3 |
6.1 |
5.9 |
|
Derbyshire and Nottinghamshire |
4.4 |
6.6 |
6.4 |
6.2 |
6.1 |
5.9 |
5.7 |
5.5 |
|
Leicestershire, Rutland and Northamptonshire |
4.0 |
6.2 |
6.1 |
5.9 |
5.7 |
5.5 |
5.3 |
5.1 |
|
Lincolnshire |
4.0 |
6.2 |
6.0 |
5.8 |
5.6 |
5.4 |
5.2 |
5.0 |
|
Herefordshire, Worcestershire and Warwickshire |
3.1 |
5.5 |
5.3 |
5.1 |
4.9 |
4.7 |
4.5 |
4.3 |
|
Shropshire and Staffordshire |
3.7 |
6.1 |
5.9 |
5.7 |
5.5 |
5.3 |
5.1 |
4.9 |
|
West Midlands |
7.1 |
9.3 |
9.1 |
8.9 |
8.7 |
8.5 |
8.3 |
8.1 |
|
East Anglia |
3.7 |
6.0 |
5.8 |
5.6 |
5.4 |
5.2 |
5.0 |
4.8 |
|
Bedfordshire and Hertfordshire |
3.5 |
6.0 |
5.8 |
5.6 |
5.4 |
5.2 |
5.0 |
4.8 |
|
Essex |
3.5 |
5.8 |
5.6 |
5.4 |
5.2 |
5.0 |
4.8 |
4.7 |
|
Inner London - West |
4.9 |
7.5 |
7.3 |
7.1 |
6.9 |
6.7 |
6.5 |
6.3 |
|
Inner London - East |
4.6 |
7.2 |
7.0 |
6.8 |
6.6 |
6.4 |
6.2 |
6.0 |
|
Outer London - East and North East |
5.9 |
8.1 |
7.9 |
7.7 |
7.5 |
7.4 |
7.2 |
7.0 |
|
Outer London - South |
3.9 |
6.4 |
6.2 |
6.0 |
5.8 |
5.6 |
5.4 |
5.2 |
|
Outer London - West and North West |
5.0 |
7.6 |
7.4 |
7.2 |
7.0 |
6.8 |
6.5 |
6.3 |
|
Berkshire, Buckinghamshire and Oxfordshire |
2.9 |
5.4 |
5.2 |
5.0 |
4.8 |
4.6 |
4.4 |
4.2 |
|
Surrey, East and West Sussex |
3.1 |
5.6 |
5.4 |
5.2 |
5.0 |
4.8 |
4.6 |
4.4 |
|
Hampshire and Isle of Wight |
3.6 |
6.1 |
5.9 |
5.7 |
5.5 |
5.3 |
5.1 |
4.9 |
|
Kent |
4.3 |
6.5 |
6.3 |
6.1 |
5.9 |
5.7 |
5.5 |
5.3 |
|
Gloucestershire, Wiltshire and Bath/Bristol area |
3.6 |
6.0 |
5.8 |
5.6 |
5.4 |
5.2 |
5.0 |
4.8 |
|
Dorset and Somerset |
3.0 |
5.4 |
5.2 |
5.0 |
4.8 |
4.6 |
4.4 |
4.2 |
|
Cornwall and Isles of Scilly |
4.0 |
6.9 |
6.6 |
6.3 |
6.1 |
5.8 |
5.5 |
5.3 |
|
Devon |
3.9 |
6.3 |
6.1 |
5.9 |
5.7 |
5.5 |
5.3 |
5.1 |
|
West Wales |
4.9 |
7.0 |
6.9 |
6.7 |
6.5 |
6.3 |
6.1 |
5.9 |
|
East Wales |
3.9 |
6.0 |
5.8 |
5.6 |
5.5 |
5.3 |
5.1 |
4.9 |
|
North Eastern Scotland |
3.6 |
5.6 |
5.4 |
5.2 |
5.0 |
4.9 |
4.7 |
4.5 |
|
Highlands and Islands |
3.1 |
5.6 |
5.4 |
5.2 |
4.9 |
4.7 |
4.5 |
4.3 |
|
Eastern Scotland |
3.7 |
6.0 |
5.8 |
5.6 |
5.4 |
5.2 |
5.0 |
4.8 |
|
West Central Scotland |
4.6 |
6.7 |
6.6 |
6.4 |
6.2 |
6.0 |
5.9 |
5.7 |
|
Southern Scotland |
3.7 |
5.8 |
5.6 |
5.4 |
5.3 |
5.1 |
4.9 |
4.7 |
|
Northern Ireland |
2.8 |
4.9 |
4.8 |
4.6 |
4.4 |
4.3 |
4.1 |
3.9 |
|
UK |
4.2 |
6.6 |
6.4 |
6.2 |
6.0 |
5.8 |
5.6 |
5.4 |
|
Country / Region |
Sep-21 |
Oct-21 |
Nov-21 |
Dec-21 |
Jan-22 |
Feb-22 |
Mar-22 |
Apr-22 |
|
Tees Valley and Durham |
6.4 |
8.3 |
15.1 |
14.3 |
11.6 |
9.5 |
9.4 |
9.3 |
|
Northumberland and Tyne and Wear |
5.9 |
8.2 |
15.9 |
15.0 |
12.0 |
9.5 |
9.4 |
9.3 |
|
Cumbria |
3.1 |
5.7 |
15.4 |
14.2 |
10.5 |
7.3 |
7.2 |
7.1 |
|
Greater Manchester |
5.3 |
7.6 |
15.5 |
14.5 |
11.5 |
9.0 |
8.9 |
8.8 |
|
Lancashire |
3.6 |
5.9 |
13.7 |
12.8 |
9.7 |
7.3 |
7.2 |
7.1 |
|
Cheshire |
3.7 |
6.0 |
13.8 |
12.9 |
9.8 |
7.3 |
7.2 |
7.2 |
|
Merseyside |
4.4 |
6.6 |
14.1 |
13.2 |
10.3 |
7.9 |
7.8 |
7.7 |
|
East Yorkshire and Northern Lincolnshire |
5.6 |
7.6 |
14.8 |
14.0 |
11.2 |
8.9 |
8.8 |
8.7 |
|
North Yorkshire |
2.6 |
5.2 |
14.9 |
13.8 |
10.0 |
6.9 |
6.8 |
6.6 |
|
South Yorkshire |
5.8 |
7.8 |
15.4 |
14.5 |
11.6 |
9.1 |
9.0 |
8.9 |
|
West Yorkshire |
4.8 |
7.0 |
14.5 |
13.6 |
10.7 |
8.3 |
8.2 |
8.1 |
|
Derbyshire and Nottinghamshire |
4.4 |
6.6 |
14.4 |
13.5 |
10.4 |
7.9 |
7.8 |
7.8 |
|
Leicestershire, Rutland and Northamptonshire |
4.0 |
6.2 |
14.2 |
13.3 |
10.2 |
7.6 |
7.5 |
7.4 |
|
Lincolnshire |
4.0 |
6.2 |
14.4 |
13.5 |
10.3 |
7.6 |
7.5 |
7.4 |
|
Herefordshire, Worcestershire and Warwickshire |
3.1 |
5.5 |
13.6 |
12.7 |
9.5 |
6.9 |
6.8 |
6.7 |
|
Shropshire and Staffordshire |
3.7 |
6.1 |
14.4 |
13.4 |
10.2 |
7.5 |
7.4 |
7.3 |
|
West Midlands |
7.1 |
9.3 |
17.1 |
16.2 |
13.1 |
10.6 |
10.5 |
10.4 |
|
East Anglia |
3.7 |
6.0 |
14.1 |
13.2 |
10.0 |
7.4 |
7.3 |
7.2 |
|
Bedfordshire and Hertfordshire |
3.5 |
6.0 |
14.2 |
13.3 |
10.1 |
7.4 |
7.3 |
7.2 |
|
Essex |
3.5 |
5.8 |
13.4 |
12.5 |
9.6 |
7.1 |
7.0 |
6.9 |
|
Inner London - West |
4.9 |
7.5 |
16.0 |
15.0 |
11.7 |
9.0 |
8.9 |
8.8 |
|
Inner London - East |
4.6 |
7.2 |
15.4 |
14.5 |
11.3 |
8.6 |
8.5 |
8.4 |
|
Outer London - East and North East |
5.9 |
8.1 |
16.1 |
15.2 |
12.1 |
9.5 |
9.4 |
9.3 |
|
Outer London - South |
3.9 |
6.4 |
14.7 |
13.8 |
10.5 |
7.8 |
7.7 |
7.6 |
|
Outer London - West and North West |
5.0 |
7.6 |
16.4 |
15.4 |
12.0 |
9.1 |
9.0 |
8.9 |
|
Berkshire, Buckinghamshire and Oxfordshire |
2.9 |
5.4 |
13.3 |
12.4 |
9.3 |
6.7 |
6.6 |
6.5 |
|
Surrey, East and West Sussex |
3.1 |
5.6 |
14.4 |
13.3 |
9.9 |
7.1 |
7.0 |
6.9 |
|
Hampshire and Isle of Wight |
3.6 |
6.1 |
14.4 |
13.4 |
10.2 |
7.5 |
7.4 |
7.3 |
|
Kent |
4.3 |
6.5 |
14.8 |
13.9 |
10.6 |
8.0 |
7.9 |
7.8 |
|
Gloucestershire, Wiltshire and Bath/Bristol area |
3.6 |
6.0 |
14.1 |
13.2 |
10.0 |
7.4 |
7.3 |
7.2 |
|
Dorset and Somerset |
3.0 |
5.4 |
14.3 |
13.3 |
9.8 |
7.0 |
6.9 |
6.7 |
|
Cornwall and Isles of Scilly |
4.0 |
6.9 |
17.8 |
16.5 |
12.3 |
8.7 |
8.6 |
8.5 |
|
Devon |
3.9 |
6.3 |
15.1 |
14.1 |
10.7 |
7.8 |
7.7 |
7.6 |
|
West Wales |
4.9 |
7.0 |
14.8 |
13.9 |
10.9 |
8.4 |
8.3 |
8.2 |
|
East Wales |
3.9 |
6.0 |
13.5 |
12.6 |
9.7 |
7.3 |
7.2 |
7.1 |
|
North Eastern Scotland |
3.6 |
5.6 |
13.6 |
12.7 |
9.6 |
7.0 |
6.9 |
6.8 |
|
Highlands and Islands |
3.1 |
5.6 |
14.7 |
13.6 |
10.1 |
7.2 |
7.0 |
6.9 |
|
Eastern Scotland |
3.7 |
6.0 |
14.3 |
13.3 |
10.1 |
7.4 |
7.3 |
7.2 |
|
West Central Scotland |
4.6 |
6.7 |
13.8 |
13.0 |
10.2 |
7.9 |
7.9 |
7.8 |
|
Southern Scotland |
3.7 |
5.8 |
13.3 |
12.4 |
9.5 |
7.1 |
7.0 |
6.9 |
|
Northern Ireland |
2.8 |
4.9 |
12.0 |
11.1 |
8.4 |
6.1 |
6.1 |
6.0 |
|
UK |
4.2 |
6.6 |
14.7 |
13.8 |
10.6 |
8.0 |
7.9 |
7.8 |