Executive summary
This report, commissioned by the National Housing Federation and the Local Government Association, examines the decarbonisation of social homes and why some are harder to decarbonise than others. We explore the characteristics and constraints of the hardest to decarbonise homes and examine how policy changes could reduce the risk of homes being disposed of when there is potential for them to be decarbonised.
A home can have a range of factors that might prevent it from being decarbonised to the levels required to reach Net Zero: technical characteristics, space constraints and external factors such as planning regulations. Homes become ‘hard’ to decarbonise when the measures required to reach Net Zero are uneconomic, logistically or technically troublesome or impose unacceptable impacts on the tenants or others.
We conclude that:
- a decarbonised home is electrically heated and has “enough” insulation
- defining “enough” insulation is not absolute. It requires a value judgement
- some homes may fail to reach a given fabric efficiency target
- various constraints can make homes hard to decarbonise
- changes are required to make hard to treat social homes easier to decarbonise.
What we need to do
Carbon dioxide (CO2) emissions from buildings must reach zero by 2050 for the UK to achieve an overall ‘Net Zero’ economy. Replacing fossil fuels with low carbon heating, principally air source heat pumps (ASHPs), can achieve CO2 reductions of 90 per cent by 2038 with further reductions as the electricity grid continues to decarbonise. However, fabric measures are necessary alongside this switch to ensure bills remain affordable, homes safe, and power supplies and infrastructure can meet demand. A decarbonised home is therefore electrically heated with “enough” insulation to be affordable to heat.
How much fabric is “enough”?
Heat pump technology can meet any level of heat demand, but reducing heat demand will always reduce bills, emissions and required space. Defining a threshold for a home to be suitable for electrification and be affordable to heat is a difficult task. We model a range of targets and compare investment with CO2 and bill reduction. A 90 kWh/m2 heat demand target results in roughly “breaking even” on fuel bills across all social homes when accompanied with a heat pump. Within this average, individual homes may see bills increase or decrease, depending on their current performance. Importantly, poor performing homes see the greatest benefit, though require higher investment.
Missing the efficiency target
A small proportion of homes will be unable to reach a given fabric efficiency target, at least without more bespoke interventions than we have modelled. These homes can still be decarbonised but may be unaffordable to heat. Then there are homes that can reach the target but require an investment that is hard to justify. Required investment will vary with size and condition of the home and available investment will depend on the value of the home in financial and social terms. We show a significant minority of homes where proposed Social Housing Decarbonisation Fund (SHDF) funding levels would be insufficient to lower the heat demand sufficiently and electrify. There are also homes that are unable to reach the target due to their wider context, such as planning or space constraints. We find that the most challenging homes are when several constraints interact. This means that reducing one constraint may unlock solutions to overcome others.
Solutions
Changes are required to make hard to treat social homes easier to decarbonise. There is no silver bullet solution, but funding is likely to be the biggest single barrier for social housing providers. Financial assistance can reduce the number of hard to decarbonise homes based on the investment required. A 10 per cent reduction in heat pump cost reduces the proportion of homes with high investment by 45 per cent. The proportion decreased by 80 per cent when modelling a £5000 heat pump grant for social homes. Adjustments to regulation and technological innovation are also required to make homes easier to decarbonise. Many of these changes would help social housing providers implement large-scale retrofit schemes, as well as helping to treat hard to decarbonise homes.
Methodology
Throughout this work we use the Parity Projects 'Portfolio' stock assessment tool on a dataset derived from the English Housing Survey (2016). We use the survey data to create a dataset that represents the whole of England and model each home represented in it with an rdSAP model of its energy performance. This allows us to characterise both the baseline performance and scenario modelling to illustrate the costs and requirements to reach defined energy performance targets.
1. Introduction
Project scope
For the UK to meet our legally binding target of net zero carbon emissions by 2050, it’s necessary for social housing providers to reduce the carbon emissions of the homes they manage to zero. Decarbonisation of social housing stock is therefore a key strategic challenge for all social housing providers. This work was commissioned by the National Housing Federation and the Local Government Association to help registered providers better understand why some homes are harder to decarbonise than others and the practical steps necessary for those that are ‘hard to decarbonise'.
The aim of this work is to better characterise hard to decarbonise homes, help to understand how social housing landlords are approaching decisions about when to retain, retrofit or rebuild these homes and what changes in policy could help reduce the risk of homes being disposed of on the private market or demolished when there is potential of them being decarbonised. It is worth noting that retrofit or renovation is almost always a lower carbon alternative to rebuilding and as the private sector is less strongly regulated than the social sector, disposal of housing here is likely to leave homes without intervention, as well as risking depletion of social housing and exacerbating the housing crisis.
For the UK to meet our legally binding target of net zero carbon emissions by 2050, it’s necessary for social housing providers to reduce the carbon emissions of the homes they manage to zero.
Report outline
The report following this introduction is structured as follows:
Section 2: The challenge of hard to decarbonise homes
Describing the challenge of hard to decarbonise homes for social housing providers, with an explanation of our definition of decarbonisation and how this relates to fuel poverty.
Section 3: Characteristics of hard to decarbonise homes
Assessing the characteristics of hard to decarbonise homes, with a focus on the technical characteristics and external constraints (planning restrictions and grid constraints) that make homes hard to decarbonise.
Section 4: Methodology
Describing the survey data used to create a dataset that represents the whole of England, the assumed costs and emission factors used in our modelling and a summary of how our Scenarios work.
Section 5: Setting targets
Setting out how to characterise when a home is ready to be electrified. We describe the chosen approach of annual heat demand and illustrate the modelling results, focussing on the question of ‘how much fabric is “enough”’.
Section 6: Regional variation
Visualising how social homes vary across the nine regions of England for current performance and the impact and cost of aligning the stock with Net Zero.
Section 7: Missing the target
Exploring why homes miss our defined decarbonisation targets, either through technical, financial or regulatory barriers.
Section 8: Solutions
Examining financial, regulatory and technological solutions that could be employed to move hard to decarbonise homes towards a Net Zero target.
Section 9: Conclusions
Summary of our key conclusions of this work.
Abbreviations
|
ASHP |
Air Source Heat Pump |
|
BEIS |
Government Department of Business Energy and Industrial Strategy |
|
CO2 |
Carbon dioxide |
|
COP |
Coefficient of Performance. A measure of heat pump efficiency. |
|
DLUHC |
Government Department for Levelling Up, Housing and Communities |
|
EPC |
Energy Performance Certificate, also used to refer to the score (out of 100) and the A-G efficiency banding. |
|
EWI |
External Wall Insulation |
|
GSHP |
Ground Source Heat Pump |
|
IWI |
Internal Wall Insulation |
|
PV |
Photovoltaic solar panels |
|
rdSAP |
Reduced Data Standard Assessment Procedure. The method used to generate EPCs for existing homes. |
|
SAP |
Standard Assessment Procedure. The method used to generate EPCs for newly built homes. |
|
SHDF |
2. The challenge of hard to decarbonise homes
The Climate Change Committee’s sixth Carbon budget spells out that carbon dioxide emissions from buildings must reach zero by 2050 for the UK to achieve an overall ‘Net Zero’ economy. There is no offset capacity budgeted to allow buildings to keep emitting beyond this point, which means that the direct burning of fossil fuels for use in homes will not be possible. This presents an inherent challenge to the social housing sector, simply due to the scale of the change required. The work required will vary hugely between homes, according to construction type, as well as where space and planning limitations prevent otherwise cost-effective measures from being applied.
Without policy change and/or funding support, social landlords may have to consider disposing of some hard-to-decarbonise homes to meet their energy performance targets. This will be either by selling into the private market or by demolishing and rebuilding. Both outcomes risk causing emissions, either from a failure of decarbonising homes in the private market or from high construction emissions. What’s more, disposals risk depleting social housing stock both overall and in specific locales, thereby exacerbating the existing housing stock crisis. This report therefore aims to better understand what makes homes hard to decarbonise and what is required to ensure that more hard to treat social homes are decarbonised rather than disposed of.
Moreover, this work focuses on asset management concerns impacting certain homes, rather than the wider barriers around financing, policy and engaging tenants, which can make any home hard to decarbonise.
2.1 Defining decarbonised
Heating from the direct burning of fossil fuels must be replaced, primarily through electrification. Our study ‘Pathways to Healthy Net Zero Housing for Greater Manchester’ found that electrification of heat through heat pumps without any supporting fabric measures would cut emissions by 90 per cent by 2038 with further reduction possible, depending on the decarbonisation of the electricity supply. In terms of reducing carbon dioxide emissions this is all that is required, but in reality insulation measures must be installed alongside heat pumps in order to alleviate fuel bills, reduce pressure on the electricity network and improve the performance and cost of the heat pump by ensuring it is appropriately sized.
In our view, a home is decarbonised if it is electrically heated, ideally using heat pumps, and has “enough” insulation. There will be opportunities for other low carbon heating in some instances, but electrification will be the default. A hard to decarbonise home in this context is one in which its, location, structure, or history present barriers to electrifying and sufficiently improving its energy efficiency to make it comfortable and affordable to heat in a zero-carbon future. Defining what is “enough” insulation is not a straightforward question. It is dealt with in detail in Section 5.5.
2.2 Fuel poverty
Whilst this report focusses on hard to decarbonise social homes, the context of increasing energy bills and the need to lower rates of fuel poverty cannot be ignored, especially for social housing. Homes that are hard to decarbonise are often also hard to heat generally, so there is often a combined need to improve them.
The context of increasing energy bills and the need to lower rates of fuel poverty cannot be ignored, especially for social housing
Retrofit measures that improve energy efficiency go hand in hand with reducing bills. Renewable energy, such as solar PV can also reduce tenant bills and emissions. The disconnect between reducing emissions and fuel poverty comes from the need to decarbonise heating systems. Mains gas is currently the most common and cheapest heating fuel in the UK, but our Net Zero target requires it to be phased out. The carbon intensity of electricity continues to reduce as renewable energy is scaled up and already offers a low carbon heating alternative through electric heat pumps. Nevertheless, electricity is more expensive than gas, so decarbonising heating can lead to higher bills. This is discussed in Section 5.4 and informs our recommendations in Section 8.2.1.
3. Characteristics of hard to decarbonise homes
An individual home can possess a range of factors that will make it more difficult and more expensive to reach very low levels of CO2 emissions, and might prevent it entirely from being decarbonised to the levels required to hit Net Zero. In the following section we present results from reviewed literature, our own experience, and that of our clients to summarise the characteristics that may make homes ‘hard to decarbonise’. It is important to recognise that these will vary in their applicability and most likely each dwelling will be unique in its set of circumstances that make it harder to decarbonise. To illustrate this variation, Table 3‑1 summarises some of the main barriers that make a home hard to decarbonise for three example property types.
|
Energy: Reduction in Heat Demand |
Energy: Decarbonised Heat Source |
Energy: Local, low carbon energy |
Health: Improved Air Quality |
|
|---|---|---|---|---|
|
Large, detached, cavity walled house |
None |
None |
None |
Budget - cost effectiveness |
|
Small, terraced, solid walled house |
Planning permission required for EWI and likely denied[i] No space for IWI |
ASHP not allowed under Planning rules |
Small PV only |
Extract vents only, no space for ducting |
|
Mid-floor flat in a multi-tenement high-rise block |
Planning permission required for EWI – only possible on a whole-block basis No space for IWI |
ASHP not allowed under Planning rule. Will require a whole-block approach |
N/A |
Extract vents only |
[i] This statement is based on anecdotal evidence from housing associations working with Parity Projects undertaking largescale retrofit programmes across the country.
An individual measure becomes ‘hard’ to install when it is a) uneconomic b) logistically or technically troublesome or c) imposes unacceptable impacts on the tenants or others. When considering how to tackle them, we need a holistic, whole-house view of these conditions and must consider them as part of an overall budget. Each hurdle or constraint is easier to tackle if the scope of any project is widened to include multiple measures, refurbishment works or additional homes.
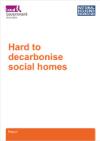
For all homes however, the tougher the target aimed for, the higher the cost of the retrofit, and more houses fall into the ‘harder to treat’ category due to budget constraints. There are also diminishing returns when investing in fabric improvement, as illustrated in Figure 3‑1, which plots the CO2 reduction and required investment for our fabric improvements installed on an example home, targeting a given annual heat demand. The difference in investment between 100 kWh/m2 and 80 kWh/m2 is just over £2,000, but to improve this further to 50 kWh/m2 requires an additional £14,000. There are diminishing returns in reaching for a higher target.
3.1 Technical characteristics
This section seeks to address the various aspects of buildings that make energy efficiency measures particularly ‘hard’ to install. These are listed in Table 3‑2. It is important to note that the presence of these features does not necessarily mean a home will be hard to decarbonise as a whole, as alternative measures may be able to make savings elsewhere. For instance, lack of outside space does not mean a home cannot have decarbonised heating as other options could be available such as district or communal heat networks.
|
Solid walls Hard to treat wall types do not have low-cost cavity wall insulation options available and/or pose technical difficulties or risks of poor performance. |
|
Flat roof homes Cannot install standard loft insulation. |
|
Terraced homes Private occupiers and leaseholders within terraced rows may be unable or unwilling to participate in retrofit schemes, which can suppress economies of scale. |
|
Heritage homes Traditional buildings (generally built before 1919 and from solid or timber frame construction), make up about 25 per cent of the UK’s total building stock. |
|
“Hard to fill” cavity walls Narrow cavity (< 50 mm), prefab concrete cavity, metal frame cavity, stone cavity, light weight timber frame, partially filled cavity, cavity >4 storeys tall. Hard to fill cavities risk poor distribution of filling and resulting thermal bridges. |
|
Space constrained Availability of space impacts the feasibility of installing core measures, eg ASHPs or EWI. |
|
High rise and tenement flats Blocks of flats present complicated barriers, especially where mixtures of tenure and ownership affects nearby parts of the building (as with terraced properties). |
|
Homes with an inaccessible loft Harder to install standard loft insulation. |
|
Park homes Presents a wide range of challenges, though possibly less relevant to the social housing sector. |
|
Bespoke Features eg bay windows, cob walls and thatched roofs More complex footprints or shapes generally make homes harder to insulate and require technical expertise. |
|
Housing subject to geographical or climate challenges Exposure to coastal climates or flood risk may add costs or affect retrofit measures in reality. |
3.2 External constraints
Beyond the home itself, there are a variety of external constraints that may make homes harder to decarbonise. This section examines the two most significant examples: planning restrictions and grid constraints.
3.2.1 Planning restrictions
Installation of retrofit measures is often slowed or halted by the need for planning permission. Guidance will vary by each authority, but generally planning policy will influence the viability of some key retrofit measures: external wall insulation (EWI), solar PV, ASHPs and window replacements.
EWI qualifies as permitted development, unless the property is located in a conservation area or is listed. If the property is already rendered, planning permission may be less of a constraint for these properties. However, if the property and most of the surrounding properties have brick walls, social housing providers are likely to come up against the planning department when attempting to install EWI. There is only really one other alternative for insulating solid brick walls: internal wall insulation (IWI). Although the costs of internal and external insulation may be similar, the disruption (and for some properties the reduction in internal space) with IWI means that social housing providers may not even consider it.
Installation of solar PV is subject to similar restrictions in specific areas as other measures. For example, arrays must not face onto or be visible from a highway if located within a conservation area or a world heritage site.
The installation of all heat pump types (air, ground and water source) are considered permitted development in England and therefore not subject to planning permission as long as all limits are met. For example, all parts of ASHPs must be at least one metre from the property boundary, which may pose a challenge for homes with a lack of outside space. Listed properties, or properties in conservation areas and world heritage sites have their own set of rules and therefore social landlords are likely to come up against planning constraints in these areas. Window replacements in designated areas (eg conservation areas) and listed buildings also require consent from relevant authorities. If double glazing is not allowed under planning restrictions, secondary glazing may be an option to improve the fabric insulation. In Section 7.3, we explore the impact of planning among other constraints on a decarbonisation scenario, highlighting where there may be difficulties in reaching Net Zero.
3.2.2 Grid constraints
Widespread rollout of heat pumps will increase demand on the electricity network and this may pose constraints on electrification for some homes. Each connection in the UK’s electricity distribution networks has a rated load, which defines the energy that can be delivered. This is defined by peak demand, which means that most of the time most of the network is running well below its rated load. Adding heat pumps in some areas will not increase peak demand above the rated load, but in other cases infrastructure will need to be upgraded.
Understanding the extent of this impact is complex and varies with location, as it depends on the interaction of the existing network and forecast heat pump installs, alongside other electrification, such as electric car charging. Fabric measures can reduce the extent of the impact in two ways. Firstly, they will lower demand. Secondly, and perhaps more significantly, they improve the ability for households to heat their homes flexibly. If homes retain heat well then heating can switch off during peak demand, which can reduce the need to increase network capacity. Increased flexibility can also help to balance the electricity network and reduce the need for energy storage.
4. Methodology
The modelling presented in this report has been conducted using Parity Projects 'Portfolio' stock assessment tool on a dataset derived from the English Housing Survey (2016). We used the survey data to create a dataset that represents the whole of England and model each home represented in it with a full rdSAP model of its energy performance, which allows us to characterise both the baseline performance and scenario modelling to characterise the costs and requirements to reach certain energy performance targets.
4.1 The dataset
The English Housing Survey is a national survey of people's housing circumstances and the condition and energy efficiency of housing in England. From this dataset we were able to build an rdSAP model of each home defined in the survey. The dataset is a statistical dataset, so although we model each home as if it were a specific home, in fact it will represent up to several thousand homes and has no geographical location beyond region. For this work we have filtered to just the social homes within the survey, which consists of 4,600 models representing around 4 million homes.
Not all fields necessary for an rdSAP model are defined within the survey, so for some fields we have had to clone in data based on our knowledge of advising the landlords of over 40 per cent homes in the social housing sector in England. This includes various details, such as heating control systems.
4.2 Assumed costs and emission factors
Energy prices and CO2 emission factors assumed in our modelling follows the Standard Assessment Procedure (SAP), which is used to generate EPCs and defined by Government. In this report all bills are taken using assumptions set out in SAP 10. These prices are significantly lower than the current energy price cap, but we require a standardised set of prices to model, and these are the most up to date. This means that the average bills and bill savings due to fabric measures will be considerably higher than set out in this report. The gap between mains gas and electricity prices is also narrower than in SAP 10, so although bills are still likely to increase due to electrification, this increase may not be so large.
Similarly, carbon emission factors are taken from SAP 10 and are a measure of CO2 equivalent, meaning they account for all sources of CO2 emissions for all homes. These are broadly stable for most fuels, as it is predominantly defined by the chemistry of the fuel. For electricity, however emissions are highly variable, but generally lowering rapidly as we build more renewable capacity and close the most carbon intensive power stations (eg coal). We already see that electricity has a much lower carbon intensity than gas and this widening trajectory is set to continue. This means that the emissions reductions due to electrification will be even more significant in the future, though the emissions reductions from fabric measures to an electrified house and PV will be less than if applied to a gas-fuelled home.
The cost of all contracted works has undergone significant increases in recent months. Our modelled prices are collected over time through our work with registered providers and are updated annually. The price of labour and material is included and ancillary work such as scaffolding is included within the overall rate for measures such as Solar PV and EWI. Any costs shown in this report do not include VAT, any remediation works unless explicitly set out, or contractor prelims. Prices vary across the country and for different organisations, but we hope that what has been presented is broadly representative. Modelled costs are unlikely to account for the ongoing price spikes in the wake of Brexit, COVID-19 and the fuel crisis, so are likely to be underestimates of prices going forward.
4.3 Scenario modelling
We have run several scenario models in which a target is defined (such as achieving 90 kWh/m2 heat demand) and Portfolio finds the most cost-effective path to achieving this target by applying retrofit measures. The permitted measures can be limited to any subset of the library of measures within Portfolio eg just fabric measures. The final performance can be characterised in a wide range of metrics, such as EPC score and CO2 emissions and indicates which measures have been installed in each home and at what cost.
5. Setting targets
As outlined in Section 2.1, we have defined a decarbonised home as electrically heated with “enough” insulation to be affordable to heat comfortably. (There will be opportunities for other low carbon heating in some instances, such as biomass, but electrification will be the predominant method.) Targets must be set in order to understand when a home has a high enough performance to be suitable for electrification and be affordable to heat. Insulation will immediately lower tenant bills and carbon emissions, while a constrained supply chain can mean homes may have longer to wait for the installation of electric heating.
We have used heat demand as our metric for targeting energy efficiency measures. Heat demand is a measure of the heat energy that a home requires to be delivered over the course of a year per unit floor area. It is therefore independent of the efficiency or fuel type of the heating system. It is also unaffected by carbon and bill assumptions, which makes it more robust to forthcoming changes to the SAP methodology, unlike EPC score, for example. Heat demand is measured in kWh/m2 and describes the annual energy use for heating.
5.1 Understanding the heat demand metric
The two key factors in heat demand are the external surface area of the building and how well they are insulated. As we are trying to characterise homes rather than households we make standard assumptions about occupancy behaviour, such as desired room temperature, as defined in the SAP 2012 Specification.
A terraced house is therefore likely to perform better than a detached house as it has less heat-sapping external wall area, but adding loft or wall insulation will improve the score (i.e. reduce the demand) in all cases.
A third influential factor is how well heating systems can be controlled. A home with poor controls will have a higher heat demand than with full thermostatic control and a timer, as energy is wasted at times and in locations where it is not needed. When modelling a heat demand target this problem is reduced for electrified homes as controls will have been upgraded with the new heating systems to meet current regulatory requirements. This is however harder to deal with when modelling the impact of insulation measures installed before heating system changes but can be dealt with by packaging heating control upgrades alongside fabric measures.
We have expressed annual heat demand as measured in kWh/m2 to offer a transferable metric to all property types and it is calculated by rdSAP based on the above factors. The lower the value, the less energy required to heat a home.
It is worth noting that any modelling methodology must make assumptions about occupancy behaviour, and these will impact heat demand values. This means that values calculated in SAP or rdSAP may differ to those from other methods as they make different occupancy assumptions. This presents a challenge in communicating targets and means that a consistent method should be used to monitor progress and make direct comparisons.
5.1.1 Examples of heat demand in practice
Table 5‑1 shows three example properties with a heat demand of approximately 90 kWh/m2. 90 kWh/m2 homes may look very different to each other and improvements to building fabric will vary. Although flats will generally have a lower heat demand than detached houses for instance, there are other factors that will counteract energy demand. The example house is an older property with uninsulated solid brick walls, however the total floor area is relatively small and the roof is well insulated, both factors that will act to reduce the space heating demand.
|
Property |
Floor area (m2) |
Age |
Walls |
Roof |
|---|---|---|---|---|
|
Ground floor, mid-terrace flat |
43 |
1930-1949 |
Filled cavity |
Another dwelling above |
|
End-terrace house |
71 |
1900-1929 |
Uninsulated solid brick |
300mm loft insulation |
|
Semi-detached bungalow |
55 |
1950-1966 |
Filled cavity |
250mm loft insulation |
Table 5‑2 provides examples of mid-terrace flats modelled with approximate heat demands of 50, 70, 80, 90 and 100 kWh/m2. Although the walls are all insulated and the properties all have flats above them (thereby reducing heat loss through the roof), there are significant differences in flat position, age band and floor area which will affect the heat demand. The flats at 50 and 90 kWh/m2 have similar characteristics overall, except for their flat positions. Heat loss through the ground for the 90 kWh/m2 flat is the prominent factor in this discrepancy. This illustrates the need to fully understand property characteristics as a whole in order to determine next steps.
|
Heat demand (kWh/m2) |
Flat position |
Floor area (m2) |
Age |
Walls |
Roof |
|---|---|---|---|---|---|
|
50 |
Mid |
50 |
1967-1975 |
Filled cavity |
Another dwelling above |
|
70 |
Ground |
71 |
1930-1949 |
Filled cavity |
Another dwelling above |
|
80 |
Ground |
39 |
1996-2002 |
Filled cavity |
Another dwelling above |
|
90 |
Ground |
48 |
1967-1975 |
Filled cavity |
Another dwelling above |
|
100 |
Ground |
31 |
1976-1982 |
Filled cavity |
Another dwelling above |
5.2 Introducing our scenarios
We have produced a range of retrofit scenarios which test different fabric efficiency targets alongside the installation of heat pumps as low carbon heat. Each scenario is generated by selecting the least-cost measures to achieve a defined performance target. Each property in the data set is tackled individually such that any overarching picture is derived based on unique need for the full data set, not a review of a smaller set of archetypes. We can then compare this with our baseline scenario, which shows the current performance of English social homes, as indicated by our model.
There are three sets of scenarios:
- Fabric only
- ASHP only
- Fabric and ASHP
For set 1 and 3 the fabric target is defined by an annual heat demand for each home and this is varied at five values between 100 and 50 kWh/m2 per year. 100 kWh/m2 is below the current average for social homes performance so less than half of homes in the dataset actually need any measures installed under this scenario, as most already reach the target. 90 kWh/m2 is the target used in wave 1 of the SHDF and is close to the median performance value of social homes at this time. The scenarios continue with heat demand targets down to 50 kWh/m2, which is very high performance, particularly for detached houses and bungalows where there is high form factor (see blue box, Section 7.1.1). The same range of fabric targets is combined with the installation of a heat pump. These scenarios are candidates for a practical Net Zero Scenario.
Then there is a standalone scenario where heat pumps are installed into existing stock without any supporting fabric measures. This is not recommended as a realistic scenario as it would increase heating bills for many households but offers a useful comparison. There will of course be a proportion of homes where a heat pump can be installed without any additional fabric measures, as heating demand is already low.
By focusing on a heat demand target, solar PV as a measure does not arise in any of these scenarios. This was a deliberate choice, as we are trying to assess the key question of how much fabric is required to support the affordable and efficient operation of a heat pump. This omission does not indicate that PV cannot be a highly valuable retrofit measure, to reduce tenant’s bills and support the decarbonisation of the electricity network.
5.3 Fabric efficiency is decoupled from emissions
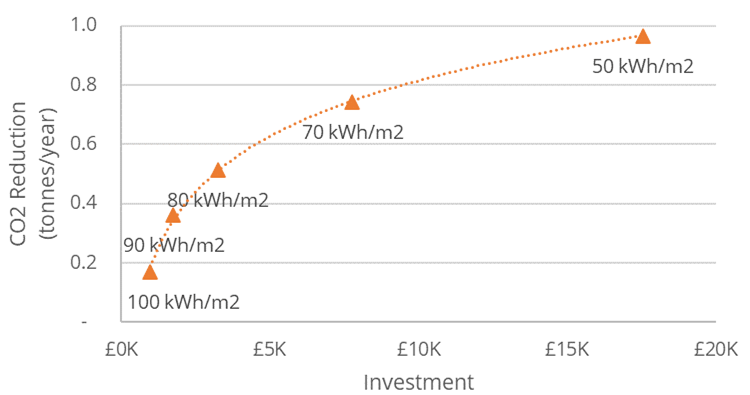
We have claimed in Section 2.1 that once low carbon heating has been installed the level of fabric efficiency has a subsequently reduced impact on lowering emissions, but a large impact on affordability and energy demand from the grid. This is supported by our modelling, which shows that fabric measures alone on existing homes can reduce emissions by a reasonable proportion, but significant emissions reductions are only possible when electrification removes the direct burning of fossil fuels. Once heating has been decarbonised the level of fabric efficiency makes only a small difference to the emissions.
Figure 5‑1 illustrates this, displaying the average carbon emissions of social housing under today’s baseline (dark blue) compared with a range of scenarios. The light blue bars show the impact of installing fabric to varying heat demand targets. 50 kWh/m2 is a very high target for retrofit, whereas most existing homes are better than 100 kWh/m2 already, meaning that this scenario targets only the worst performing homes. The yellow bar represents installing only heat pumps in each home, which makes a huge carbon reduction compared to any of the fabric scenarios. In our modelling the emissions from heat pumps are calculated using the carbon factors defined in SAP 10 and set to be indicative of today’s emissions. These emissions are forecast to reduce towards zero as the electricity network decarbonises further.
The green bars combine a fabric target with the installation of heat pumps. The emissions as a result of the green scenarios do not vary significantly, which indicates that emissions are not a sensitive metric to define “enough” insulation for a home.
5.4 Cost differential between gas and electricity
As shown above, electrification is crucial for cutting emissions, but this won’t necessarily reduce bills. Ideally, we would like retrofit packages to reduce energy bills but when moving from mains gas to electric heating, they will generally increase, even with a heat pump, due to the large price differential between gas and electricity.
Under the price cap as of April 2022, electricity is 3.8 times more expensive than gas per unit of energy. Heat pumps can have a Co-efficient of Performance (COP) greater than 1, which means they can deliver more heat energy than the supplied electrical energy, whilst even the most efficient gas boiler will lose some energy. This reduces the difference in cost for delivered heat, but electricity is still unlikely to be cheaper under current prices when replacing a modern boiler with a heat pump. Energy costs and carbon emissions are misaligned, which makes it difficult to encourage the uptake of low carbon heating.
Our model uses costs as defined in SAP 10, in which electricity is 4.5 times more expensive than gas. This means that relative bill increases from installing heat pumps in this work may be over-estimates though absolute values for bills will be an under-estimate, as the price cap increased for both electricity and gas in April.
5.5. How much fabric is “enough”?
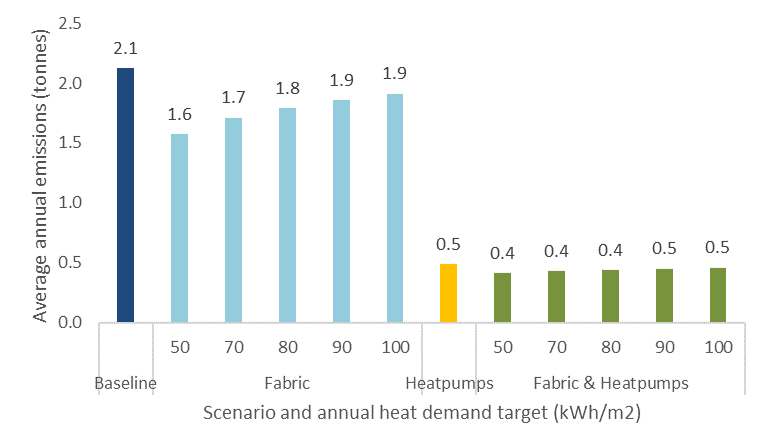
To assess the right level of fabric we need to assess the impact on bills. Figure 5‑2 shows the average fuel bill savings for our range of scenarios.
When heat pumps are installed without fabric improvements, fuel bills rise on average by £56 a year (yellow bar). Fabric measures installed alone are an effective way to reduce bills (light blue bars) and can compensate the cost of running a heat pump (green bars) as long as the target is high enough. A fabric target of 90 kWh/m2 heat demand compensates the increase in bills from installing heat pumps to mean that the average bill roughly breaks even.
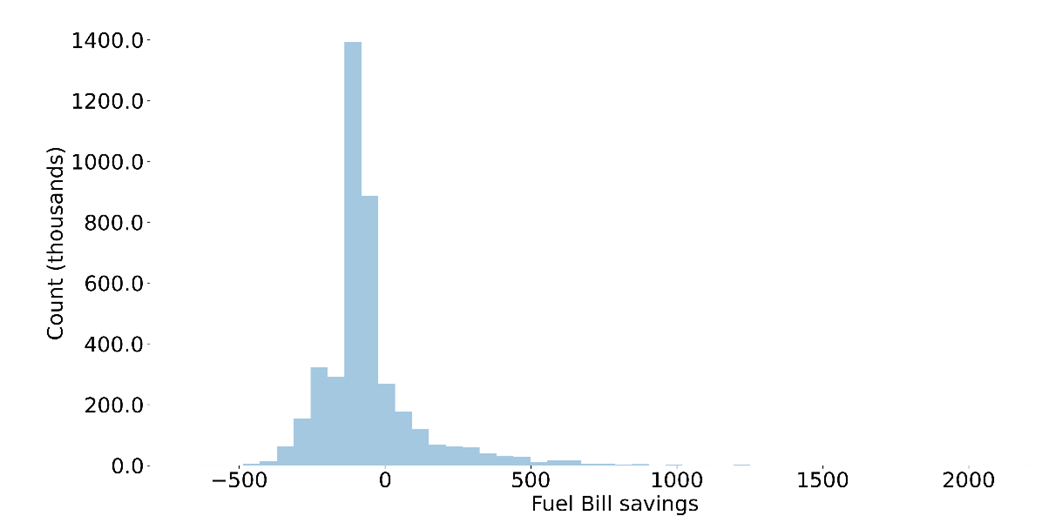
The 90 kWh/m2 target, which was used by Government in wave 1 of the SHDF, results in roughly “breaking even” when accompanied with a heat pump, but is a clear saving if fabric measures are installed alone. Existing homes with a low heat demand will mostly see an increase in bills from the heat pump if no additional fabric measures are applied, but the average change in bills across a whole stock of homes is compensated by those homes where the fabric efficiency is improved enough to reduce their energy bills. Figure 5‑3 shows the distribution of fuel bill savings for each home under the heat pump only scenario. Most homes see an increase in bills (i.e. a negative saving), though a small proportion see a substantial saving, these are where the current heating system is very inefficient or expensive.
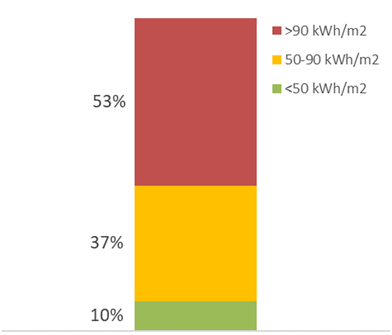
For all scenarios with a heat demand target driving fabric measures alongside the heat pump there will always be a portion of homes that are unaffected because they already achieve the required heat demand target. Figure 5‑4 shows the proportion of the dataset with baseline annual heat demand greater or less than 50 and 90 kWh/m2. Around 50 per cent of the existing stock have a heat demand higher than 90 kWh/m2 and 10 per cent have a heat demand lower than 50 kWh/m2 already. This means that 10 per cent of homes will not have any fabric measures installed under any of our scenarios and with a 90 kWh/m2 target only around half of homes will have any supporting fabric. Just assessing the average hides the fact that the best performing homes will see increased bills and worse performing homes reduced.
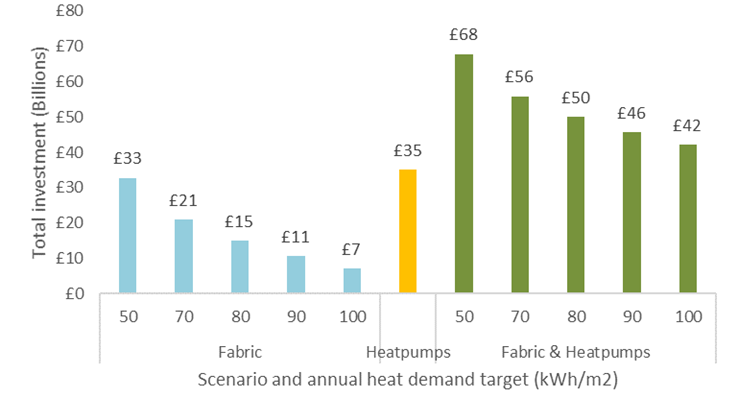
The cost of each scenario for the 4 million social homes within the EHS dataset is shown in Figure 5‑5. The fabric scenarios show that there are diminishing returns in reaching higher targets, as less cost-effective measures are applied. The heat pump represents more than half the investment for all of the combined scenarios. This points to the general decarbonisation barrier of the high cost of heat pumps, as well as the necessity for alternative solutions, such as heat networks and storage heaters in some instances.
The installation of a heat pump will often negate the cost of boiler replacement, so it could be argued that just the additional cost should be modelled. Whilst this approach makes sense for a housing provider when planning work, we have not done this in our modelling, as it requires knowledge of replacement schedules. Some boilers may also need to be replaced with heat pumps ahead of their end of life, in order to align with other work, meet funding deadlines and meet climate targets.
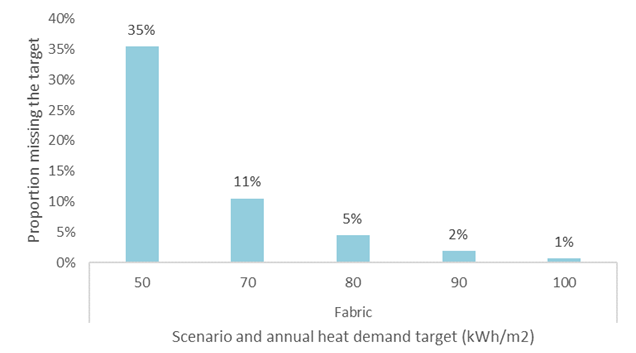
Heat demand was chosen as a metric as it characterises fabric efficiency independent of fuel and avoids solar PV hiding poor fabric performance. 90 kWh/m2 annual heat demand was originally recommended as a target as it aligns with Government policy and funding and our previous work indicated that it is generally achievable through standard fabric measures. Figure 5‑6 aligns with this, with only 2 per cent of homes failing to reach this target. Homes missing this 90 kWh/m2 target are further characterised in Section 7.1.
5.6 Varied targets
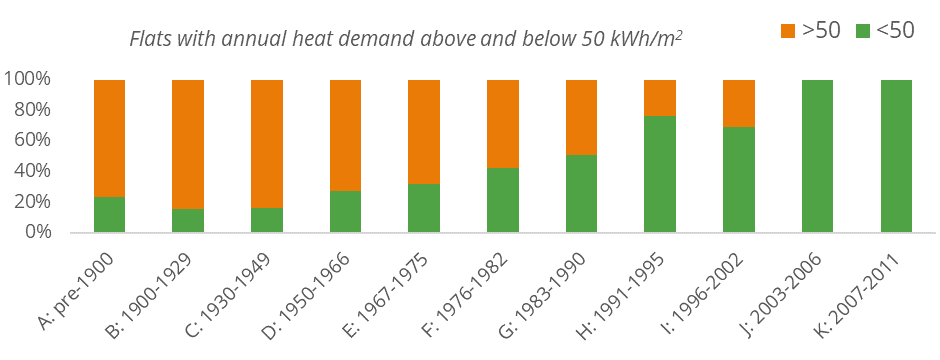
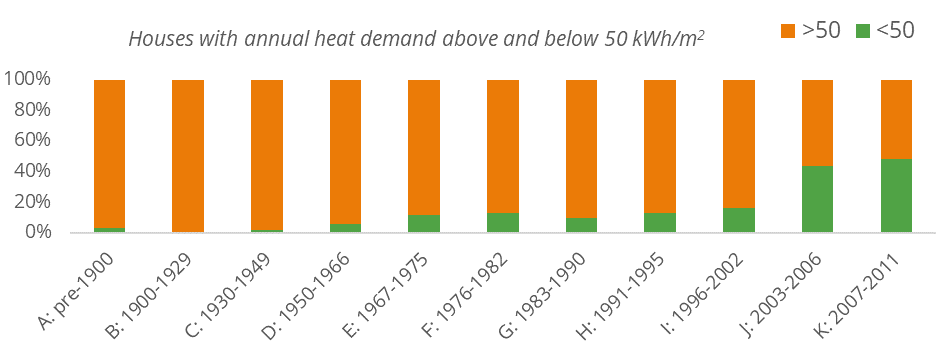
It is worth considering that an effective target may also differ between different archetypes. Figure 5‑7 shows the proportion of homes with current heat demand above and below 50 kWh/m2 by age band for both houses and flats. Reaching this target is rare for houses and bungalows, even for new builds, whereas most modern flats achieve this.
A more nuanced approach to modelling a target might be to flex this target for different archetypes. It is important to remember that there is no definite level of heat demand required for a heat pump to be installed and to perform as per the manufacturer’s performance standards. Heat pump technology can meet any level of heat demand providing there is enough space for the equipment to be installed and cost is no issue, but a reduction of heat demand will always reduce bills and emissions at the same time.
6. Regional variation
The English Housing Survey provides data at a regional level, allowing us to explore how social homes vary across the nine regions of England. Each region within our analysis still has a wide range of homes within it, but we can still explore general trends across the country. Figure 6‑1 shows how the current EPC scores vary across the nine regions.
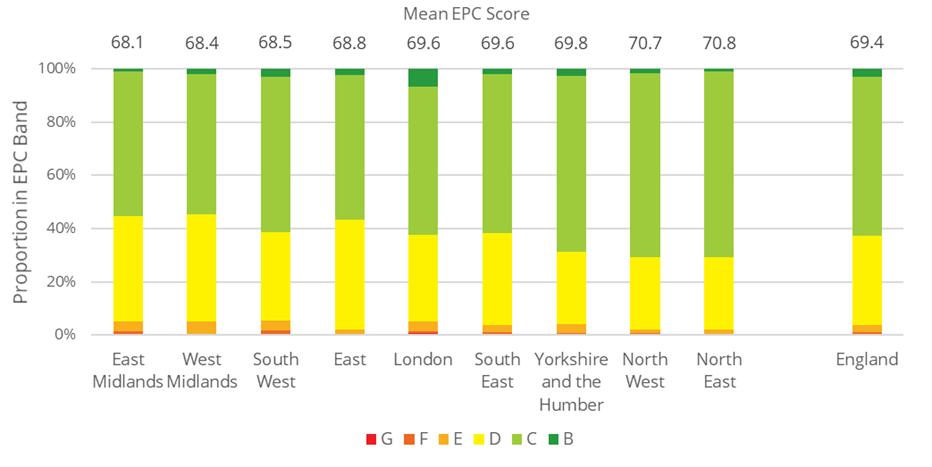
The mean scores shown at the top of the figure vary only by 2.7 points, but within this the split of homes in each band varies more significantly with the North East having less than 30 per cent of homes rated below EPC C, but the West midlands having more than 45 per cent. Equally the proportion of homes rated above EPC C varies from 0.89 per cent for the East Midlands to 6.84 per cent of homes in London.
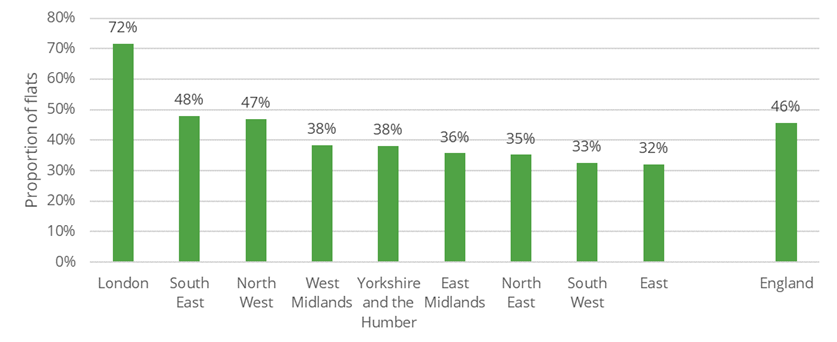
Trends in EPC band are driven by both the efficiency of the homes, but also the make-up of the stock itself. EPC scores are generally higher for flats than houses, as these have a lower heat loss area, and the proportion of flats within the social housing stock varies considerably between regions, as shown in Figure 6‑2. The considerably higher proportion of flats in London aligns with the greater proportion of EPC B rated homes.
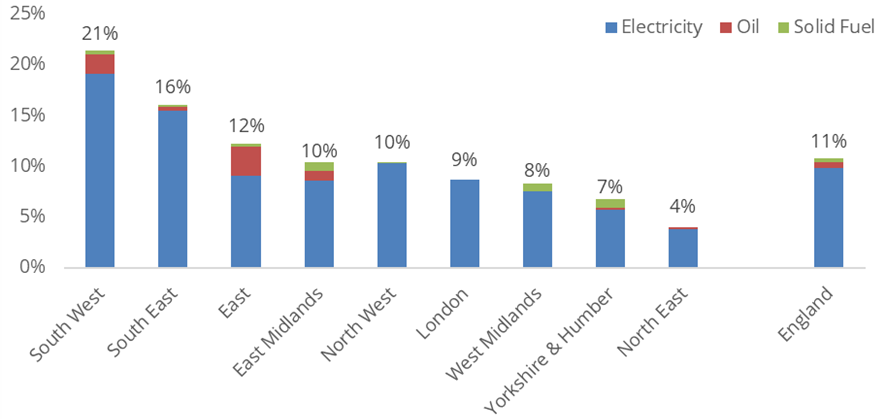
Another significant variation across regions is heating fuel. Figure 6‑3 shows the proportion of homes not heated by mains gas, which varies by more than a factor of 5 from 4 per cent in the North East to 21 per cent in the South West. A lower proportion of mains gas makes economic arguments for heat pumps simpler, as they are likely to reduce bills.
6.1 Scenario impact
As the baseline social housing stock varies across the regions of the UK, so too does the impact and cost of aligning the stock with Net Zero. We have outlined a Net Zero target in Section 5 in which fabric measures are applied to each home targeting an annual heat demand of 90 kWh/m2 and heating is electrified through installing heat pumps. We modelled this through a scenario, which finds the most cost-effective path to reach the heat demand target and then installs the heat pump.
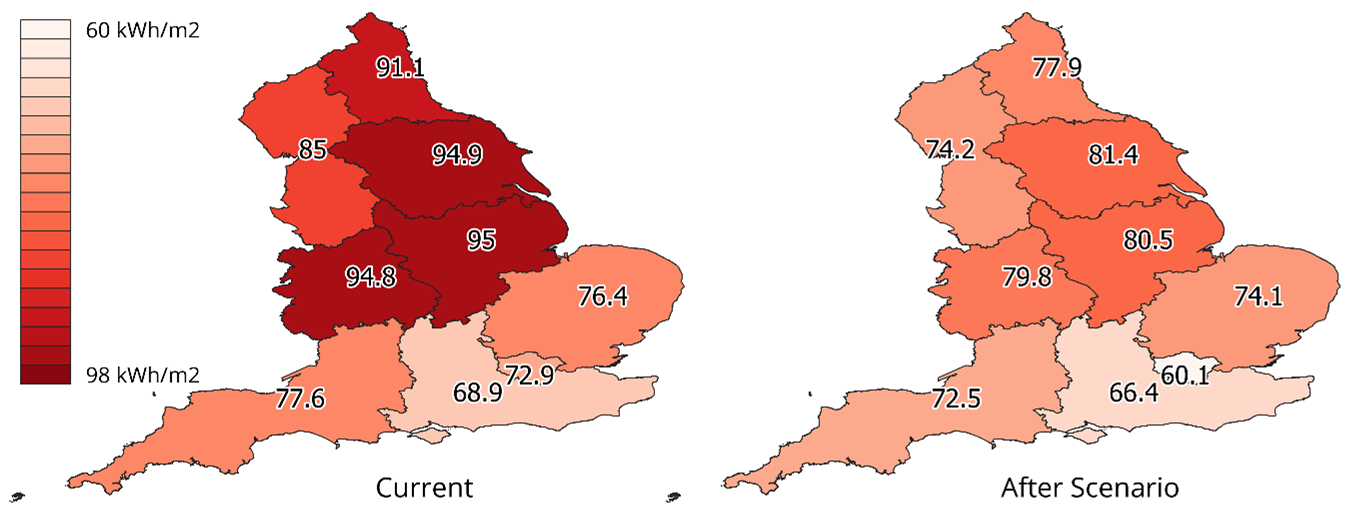
The scenario makes a significant reduction in average annual heat demand across all regions, as shown in Figure 6‑4. The areas with the highest current average heat demand still have higher heat demand, which is in part due to the different climates, as the SAP model considers regional weather in the calculation of heat demand. There are also differences due to the typical archetype, such as the proportion of flats. One interesting trend is that London currently has higher heat demand than the Southeast but has considerably lower demand after the scenario and the lowest of any region.
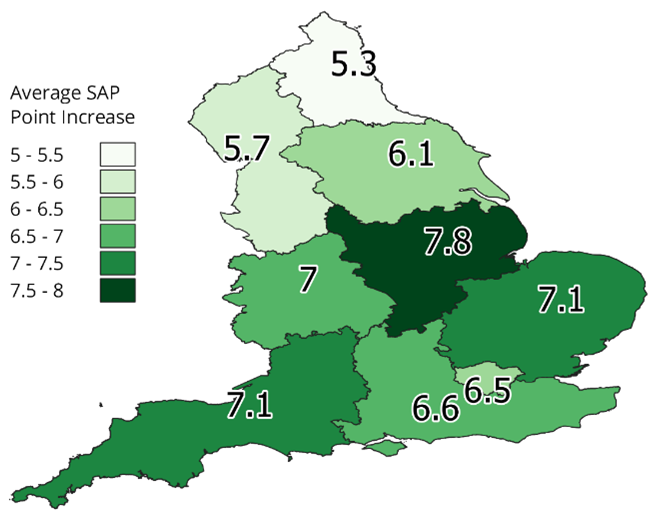
Similarly, the improvement in the average EPC score for each region under the scenario is shown in Figure 6‑5. The East Midlands makes the largest improvement in terms of EPC score and is the region with the lowest current EPC score.
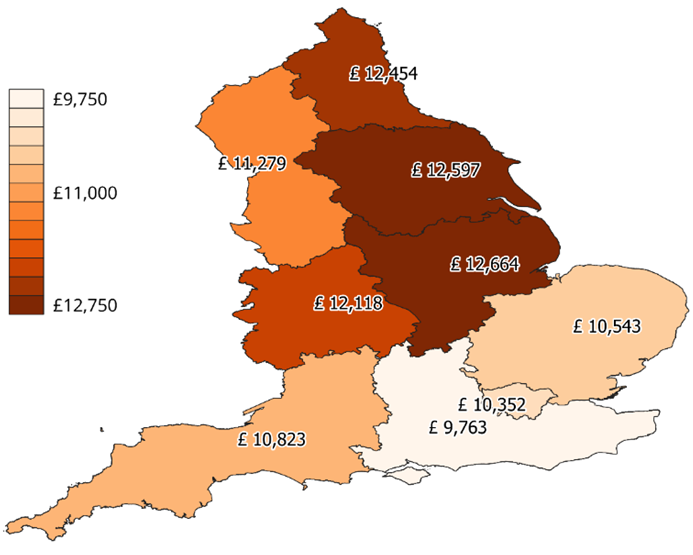
The East Midlands also shows the highest average investment of any region, as shown in Figure 6‑6, which makes sense as it is seeing the largest EPC improvement, indicating more fabric work required under the Net Zero Scenario to improve heating demand to 90 kWh/m2. These costs include only the direct costs of implementing the work; they do not include ancillary costs, such as tenant engagement or project planning. The prices used in our model are also uniform across the country, so although the south of England shows generally lower investment, this may be more than compensated by higher regional costs. There is a correlation between the improved heat demand and the required investment across all regions, except for London which has lower average investment than would be expected, due to the high proportion of flats. Both of these metrics are driven directly by the extent of fabric measures.
7. Missing the target
This section explores the reasons homes miss the decarbonisation target we have defined, either through technical, financial or regulatory barriers. In Section 5 we modelled a range of retrofit scenarios and settled on a working definition of a decarbonisation target as: 90 kWh/m2 annual heat demand alongside a heat pump. Here we investigate three areas in which a barrier to meeting the target can occur.
Firstly, there are homes that outright fail to reach the target with no restrictions on budget or permitted measures. This indicates that within our model the home cannot reach the target in the best of circumstances. This does not mean it would be impossible for the home to reach the target, but it may require more bespoke interventions than we have modelled. Thereafter there are homes that can reach the target but require an investment that is hard to justify. Finally, we then consider homes that are unable to reach the target without relying on measures restricted by other limits, such as planning restrictions.
7.1 Technical limits
For the 90 kWh/m2 scenario 2 per cent of properties fail to reach this target heat demand. In the following sections we attempt to characterise the social homes that miss the target to discover if there are certain types of home that are generally more challenging to decarbonise than others.
7.1.1 Property type
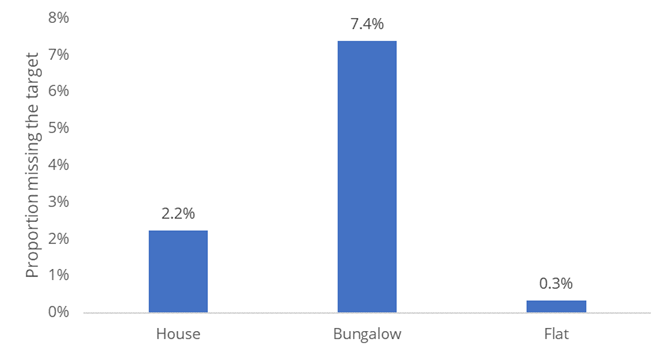
Here we assess the proportion of homes within each property type that fail to reach the 90 kWh/m2 target. Across the stock, bungalows are most likely to miss the target, by a significant margin, followed by houses, whilst flats have a very low proportion of homes missing the target, as shown in Figure 7‑1. This aligns with the trend of a decreasing Heat Loss Form Factor, explained in the box below.
Heat Loss Form Factor
The Heat Loss Form Factor, as defined by the Passivhaus Standard, is a way to measure the ‘compactness’ of a building: the ratio of surface area that can lose heat (the thermal envelope) to the floor area that needs to be heated. A lower form factor indicates a more compact building, and therefore less insulation will be required to reach a certain level of energy efficiency. More compact properties, such as flats and maisonettes, require less insulation. Less compact properties, such as houses and bungalows, have a higher form factor and require more insulation for them to be energy efficient.
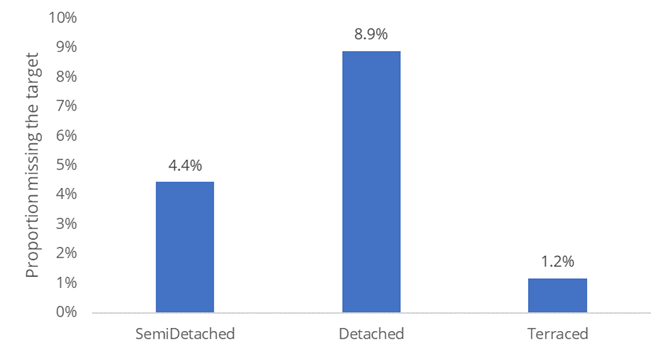
Similarly with regard to detachment, detached properties have a higher proportion of homes missing the heat demand target than semi-detached and terraced properties, as shown in Figure 7‑2. The conclusion that having less exposed area helps to achieve lower heat demand is not surprising, but the difference it makes is considerable. A detached house is more than 7 times likely to fail to meet 90 kWh/m2 in our scenario than a terraced house. Detached properties will have higher Form Factors, and more insulation will be required to reach a certain energy demand.
7.1.2 Age band
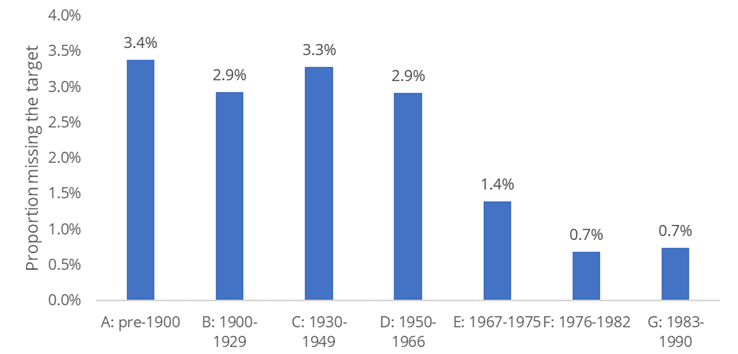
Age also makes a big difference to the ability to reduce energy demand. No homes built since 1990 missed the target in our scenario and the proportion missing the target drops significantly after 1966, as shown in Figure 7‑3. 1966 saw the introduction of modern building regulations and the first tangible moves towards home energy conservation. From 1976, cavity wall thermal performance improved further, loft insulation levels increased and suspended timber floors were often sealed which all reduced heat demand. Older properties generally have higher rates of failure, but the vast majority of even the oldest properties are still able to reach the 90 kWh/m2 target.
7.1.3 Building fabric
Beyond the age and property type there are various attributes of homes, which make them more or less likely to reach the heat demand target. Identifying the cause for homes failing to meet the target among our dataset has proved challenging to analyse because of the high levels of correlation between different attributes.
Table 7‑1 shows an example of the proportion of homes with different combinations of roof and wall types failing to reach the 90 kWh/m2 target. The first column shows how homes with a dwelling above (i.e. ground and mid floor flats) can almost always reach the target, regardless of wall type. This is not surprising and aligns with the low failure rate for flats, shown above.
| Roof: Dwelling Above | Roof: Insulated | Roof: Little or no insulation | All roofs | |
|---|---|---|---|---|
| Empty cavity wall | 0.0% | 14.2% | 10.0% | 8.4% |
| Filled cavity wall | 0.0% | 0.5% | 0.4% | 0.3% |
| Solid wall | 0.0% | 1.0% | 2.2% | 1.0% |
| Solid EWI wall | 0.0% | 5.9% | 4.3% | 3.4% |
| All walls | 0.0% | 2.4% | 2.9% |
There is a relatively high proportion of failure among homes with an empty cavity. This is not because these cannot be insulated, as our model will fill these cavities. Rather it indicates a correlation with mid-century properties, which may have other features that make them hard to decarbonise. It is surprising then to see lower proportions for solid walled homes, as these are often hard to insulate. In our model we have assumed that all solid walled properties could receive EWI or IWI, which means they are likely to reach a higher thermal performance than cavity walls. In reality, there may be barriers to the installation of solid walled insulation, as discussed in Section 7.3. Untangling these correlations within the data set has not led us to any conclusions about which homes are harder to decarbonise, other than the above conclusions that a large heat loss area makes it hard to get to very low heat demand.
7.2 Financial limits
The previous section examined homes that failed to meet the 90 kWh/m2 target at any cost. In reality, some may only achieve this alongside heat pump installation through prohibitively expensive packages. Under this Net Zero Scenario, 5 per cent of homes have a required investment of greater than £20,000. This value represents £10,000 of Government funding, the lowest funding band of SHDF Wave 1, plus 50 per cent matched funding. We needed to use a single threshold as a metric to compare homes across EPC bands, to avoid conflating the budget limits with the work required. As the vast majority of social homes are in band D it makes sense to choose the budget limit for this lower end of the scale. EPC E, F and G rated homes can apply for more funding through SHDF.
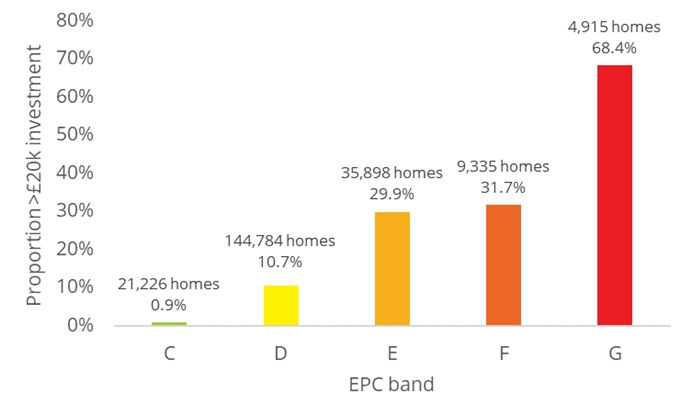
Figure 7‑4 shows the proportion of homes in each EPC band that have a cost greater than this threshold. No homes with modelled SAP ratings of A and B have investments greater than £20,000, so these do not feature in the graph. Unsurprisingly, the proportion of homes with Net Zero investments more than £20,000 is greater for lower SAP bands. Nearly 70 per cent of G-rated properties have a Net Zero investment more than £20,000, whereas it is less than 1 per cent for C-rated. These proportions hide the fact that the highest number of high investment homes are in EPC band D, as there are many more D-rated homes overall, compared to lower performing bands. The characteristics of properties with investments greater than £20,000 illustrate patterns like those described in Section 7.1. They are usually old, detached bungalows or houses, with solid brick walls and little or no loft insulation.
This is a fairly blunt tool to assess investment barriers. For some poor performing homes there may be wider renovation work required that means high investment can be justified for improving energy efficiency. In other cases, what might seem like a low investment may not be able to be justified against the value of a property. Assessing this balance requires broader data. This statistical analysis is not able to assess the wider context around these decisions.
Whilst there are funding schemes available to help property owners with some of these costs, such as the Boiler Upgrade Scheme for heat pump installation, these are not available to social housing providers. Instead, BEIS expects decarbonisation of social homes to be supported by the SHDF. The competitive nature of this programme makes it difficult for social housing providers to plan heat decarbonisation strategy as they lack certainty over funding, as well as creating additional administrative costs from submitting bids. It is not clear why grant support for low carbon heating is reserved solely for the privately owned homes.
7.3 Additional limits
In this section we analyse the impact of additional restrictions on decarbonising homes. These restrictions can arise from practicalities around planning, space and the disruption caused to tenants. We have modelled three scenarios on an example property, which is a small, terraced, solid-walled house. For each scenario we illustrate the SAP score, annual CO2 emissions and required investment. The scenarios are as follows:
- Empty home (no need to consider disruption to the tenant)
- Occupied home (seeking to minimise disruption to the tenant)
- Occupied home in a conservation area (seeking to minimise disruption and with constraints on external works)
These scenarios aim to represent three broad examples of possible additional limitations on a home, showing no additional restrictions to having severe limitations from a combination of planning, disruption and space constraints.
7.3.1 Empty home
The empty home has no limits to the recommended measures that can be installed. The property has a deep fabric retrofit with floor insulation and underfloor heating installed simultaneously, allowing a lower flow temperature ASHP to be used. Table 7‑2 shows the cumulative impact of this package. Each line shows the EPC score and annual carbon emissions for the combination of all measures installed up to that point.
|
EPC Score |
CO2 (kg) |
|
|---|---|---|
|
Existing home |
53 E |
4,242 |
|
Loft insulation top-up |
54 E |
4,156 |
|
EWI |
69 C |
2,480 |
|
Fill party wall cavity |
69 C |
2,442 |
|
New A+ double glazing |
71 C |
2,232 |
|
Floor insulation |
72 C |
2,039 |
|
ASHP with underfloor heating |
65 D |
665 |
|
Solar PV |
80 C |
375 |
|
Final |
80 C |
375 |
This scenario results in a CO2 reduction of 90 per cent, which will keep reducing as the electricity grid decarbonises, reaching just 19 kg per year under Government Department of Business Energy and Industrial Strategy (BEIS) projections for 2050 carbon factors. The required investment for this work package is £38,000, almost 70 per cent of which comes from the EWI and ASHP with underfloor heating, the key measures for reducing carbon emissions. The PV makes up around 10 per cent of the cost and this provides a significant boost to the SAP score and reduces bills significantly.
7.3.2 Occupied home
The next scenario we’ve modelled represents the restrictions arising from an occupied home, where disruption must be minimised. In this case this means that underfloor heating and insulation are restricted. Table 7‑3 shows the cumulative impact of these measures and we can see that in this case the impact is not too severe. EPC score and emissions are both marginally worse than the case above, due to the uninsulated floor and the less efficient ASHP system. This also acts to reduce the cost to £32,500. This shows that even when some measures are possible, they may be not cost effective in the context of the overall work package.
|
EPC Score |
CO2 (kg) |
|
|---|---|---|
|
Existing home |
53 E |
4,242 |
|
Loft insulation top-up |
54 E |
4,156 |
|
EWI |
69 C |
2,480 |
|
Fill party wall cavity |
69 C |
2,442 |
|
New A+ double glazing |
71 C |
2,232 |
|
ASHP with existing radiators |
64 D |
687 |
|
Solar PV |
78 C |
398 |
|
Final |
78 C |
398 |
7.3.3 Occupied home in a conservation area
The third scenario we present is starkly different from the two presented above and represents strict restrictions on the measures that can be applied. In this case, planning rules have prevented EWI, an ASHP and PV. This is very much a worst-case scenario, as all of these measures are often allowed on the off-street side of a home, even in a conservation area.
EWI can sometimes be replaced with IWI, but in many cases concerns over space and disruption prevent this. Instead of an ASHP, which requires a small external unit, heating has been electrified using storage heaters with an immersion for hot water. This allows cheaper off-peak electricity to be used throughout the day, but without the efficiency gains of a heat pump. The impact of these measures is to reduce emissions by about half, as shown in Table 7‑4, and as heating has been electrified these emissions will continue to fall. The package also decreases the EPC score by 10 points, indicating a significant increase in bills. This is due to the replacement of gas heating with more expensive electricity without the efficiency gain of a heat pump.
|
EPC Score |
CO2 (kg) |
|
|
|---|---|---|---|
|
Existing home |
53 E |
4,242 |
|
|
Loft insulation top-up |
54 E |
4,156 |
|
|
Fill party wall cavity |
54 E |
4,122 |
|
|
High heat retention storage heaters |
43 E |
2,135 |
|
|
Final |
43 E |
2,135 |
|
This scenario comes at a much lower cost of £4,600, as much less work has been done than the other two scenarios. It is unlikely to be an acceptable offer to tenants, as it acts to increase their bills, as well as giving them a less familiar heating system, but it is an effective way to reduce emissions, requiring just £2 investment for every annual kg of CO2 emitted. The other scenarios above have much higher costs per kg of CO2 saved, though they do make the largest savings and make the home more affordable to heat.
Where one measure is prevented, there are often alternative approaches. For example, IWI can be used where planning restrictions prevent EWI. Frequently though limitations combine together in the same property i.e. space and disruption concerns prevent IWI as an alternative. This can lead to very few options, as in this example.
7.3.4. Comparisons
These three examples illustrate the range of constraints that can impact a home. These can have a dramatic influence on the ability to decarbonise homes and to reduce fuel bills, as in the third example. Where such limitations vary between otherwise similar homes this can also add complexity and cost to the design and delivery of retrofit programmes. A recurring challenge with managing these barriers is a shortage of high-quality data about the inside space, outside space and often even the details of planning rules affecting an area.
Even for a home with the most restrictive barriers a well-resourced and determined individual could usually overcome them. For social housing landlords, however, additional complexity means homes are more likely to be disposed of, or simply languish at the bottom of the pile as other homes begin to be decarbonised at scale.
8. Solutions
Hard to treat homes cannot all be demolished out of existence as this would be a waste of the embodied carbon dioxide needed to replace them and comes at a very high cost. Disposal of homes through selling into the private sector also poses a risk to the UK’s Net Zero requirements, as private homes face less stringent energy performance targets. Additional thinking and support is required to make hard to treat social homes easier to decarbonise.
8.1 Financial solutions
The high initial costs of key decarbonisation measures, particularly heat pumps, are a barrier to social housing providers to play their part in achieving the UK’s Net Zero goals. To investigate how financial policy changes could affect the number of hard to decarbonise homes, we have modelled changes to the pricing of heat pumps based on the following hypothetical scenarios:
- £5000 heat pump grant
- 10 per cent reduction in the price of heat pumps (£800)
A standard price of £8000 for a heat pump was chosen to investigate the effects of financial changes on the number of hard to decarbonise homes. It is acknowledged that there is likely to be significant variation in the price of heat pumps but here we only seek to give an indication of cost changes. The £5000 heat pump grant was chosen to illustrate what an incentive like the Boiler Upgrade Scheme could do for social housing.
Table 8‑1 shows the impact of financial solutions on the number of hard to decarbonise homes based on the investment required. Just over 5 per cent of properties have investments greater than £20,000 to reach Net Zero, but this reduces to 1 per cent and 3 per cent for a £5000 heat pump grant and 10 per cent heat pump cost reduction, respectively.
There may be options for targeting such a grant scheme at only certain homes, but it is difficult to see how this would be done effectively. Homes requiring high investment is principally due to greater fabric requirements. Fabric should be improved first though, making it hard to target a grant for homes with poor fabric. Homes with inefficient heating systems could be targeted, but as a heat pump is not more expensive in these cases this is unlikely to correlate with homes with higher required investment.
|
Scenario |
Proportion of properties > £20,000 without intervention |
Proportion of properties > £20,000 with intervention |
% reduction |
|---|---|---|---|
|
£5000 heat pump grant |
5.3% |
1.1% |
78.5% |
|
10% reduction |
5.3% |
2.9% |
45.3% |
Percentage changes for the number of properties with Net Zero investments greater than £20,000 are shown for each SAP band in the following sections.
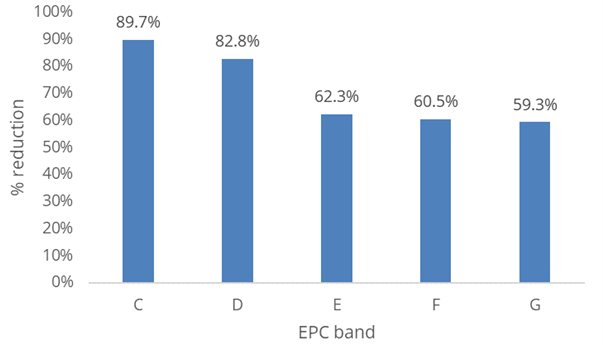
8.1.1 £5000 heat pump grant
Figure 8‑1 shows that a £5,000 grant for heat pumps could make a substantial difference to the affordability of heat pumps for social housing. There is a 90% reduction in the number of EPC C properties requiring greater than £20,000 investment, indicating that the heat pump is a major portion or the required investment in these cases. These graphs should be interpreted with caution however, as there are fewer C-rated homes with investments greater than £20,000 to begin with (Section 7.2).
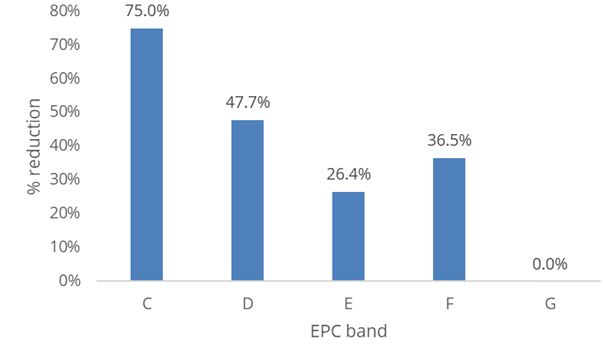
8.1.2 10 per cent reduction in heat pump cost
Figure 8‑2 shows that even with a small change in heat pump cost of 10%, the number of properties with investments greater than £20,000 falls dramatically for some SAP bands. However there is no change for G-rated properties, indicating that the overall cost of retrofit for these properties is higher than other SAP bands.
8.2 Policy Environment
There are a wide range of policy changes that could make the decarbonisation of social homes easier. In this section we have described several regulatory barriers that impact social housing decarbonisation, accompanied with proposals for reducing their impact.
8.2.1 Electricity vs gas prices
Electrification is crucial for decarbonising homes, yet social housing providers are unable to electrify homes when doing so would lead to an increase in bills for their tenants. Electricity is currently several times more expensive than gas, posing a systemic barrier to electrification, as discussed in Section 5.4. Furthermore, high electricity prices ensure that a higher level of fabric performance is required for affordability. The required investment for some homes would decrease if electricity were cheaper.
One measure proposed to better align prices with carbon emissions is to move green levies on electricity bills into general taxation. Under the new price cap these levies add around £150 to a typical dual fuel bill, around 8 per cent of the total bill with the majority placed on electricity. Removing levies from electricity would reduce electricity bills relative to gas, incentivising electrification, as well as reducing bills overall.
These levies are used to support various energy efficiency improvements, renewable projects and fuel poverty initiatives such as the Warm Homes Discount scheme. These are policies that work towards decarbonisation, so it is important that they are not scrapped. Balancing these between gas and electricity bills would also reduce the cost differential between the two fuels, but there are concerns that this would increase bills for households that are least able to make the switch to heat pumps due to prohibitive pricing.
The current energy crisis is acting to reduce the cost difference between the two fuels, as gas prices are rising more quickly than electricity. This means that the advantage in cost effectiveness that boilers have over heat pumps has reduced. This may weaken the weight of argument for policy action, though it is unlikely to close the gap entirely.
8.2.2 Methodology changes
The current Energy Efficiency Rating has various drawbacks, and we believe revisions are necessary to support decarbonisation:
- EPC scores measure energy cost adjusted by floor area, and therefore do not align directly with emissions reductions as more polluting fuels can often be cheaper. An EPC fit for the future needs to reward affordable decarbonised homes.
- EPC data is valid for up to ten years, and there is no requirement for homeowners, landlords or installers to update it, even at the point of marketing. As more regulations and funding relate to the EPC of a home, the Government must ensure EPCs are up to date at the related trigger points, whether that is selling, letting or claiming funding.
Net Zero homes must be ‘heat pump ready’, grid-friendly, healthy, and affordable to heat. However, single metrics like EPC rating are not able to adequately describe these Net Zero homes. We recommend that a ‘scorecard’ for homes is required, using 3 to 5 metrics to ensure homes meet the various dimensions of a desirable low carbon future such as SAP as a measure of affordability, carbon emissions, heat demand, ventilation levels, and overheating risk. These metrics could be reported as KPIs on the EPC, with suggested targets, potentially differentiated by the potential of the home for demand reduction.
Data is key to effective decarbonisation strategy. The Government and its funded policies are storing related data in different silos and worse, property-owners do not have a right to access the data collected on their own homes. This is currently the case in relation to data collected through EPCs and there is the risk that housing providers will not have a right to free access to the data collected and lodged for the completion of PAS2035 accredited energy efficiency measures. The Government must urgently give property-owners a right to data collected on their own homes for the purpose of Government programmes. Not least because the property-owners fund the data collection.
8.2.3 Planning restrictions
In Section 3.2.1 we discussed how planning policy can influence the viability of some key retrofit measures. We explored this further in Section 7.3 by looking at the impact of various restrictions (including planning) in an occupied home, showing a very limited potential for decarbonisation in the worst-case scenario.
We believe that relaxations to planning restrictions have the potential to make some currently hard to decarbonise homes much easier. Some UK councils are already embracing this: recently the Royal Borough of Kensington and Chelsea became the first council in the UK to allow solar panels on most Grade II and some Grade II* listed buildings without the need for individual listed building consent. The Council said this was to “give a very clear signal to residents and businesses that we take seriously the need to drive down carbon use and are prepared to be proactive in achieving this”.
It's possible that relaxations to planning restrictions will become inevitable for many authorities, but these changes need to happen now if the UK is to reach its Net Zero goals. To enable this facilitation, there needs to be more widespread guidance across the UK about how to retrofit listed buildings and properties in conservation areas, as advice is incongruent between authorities. Furthermore, although there is a national register of listed properties, there is no national dataset for homes that are subject to the restrictions placed on retrofit measures in conservation areas. Through Parity Projects’ experience working with social housing providers, we know that many of them do not know whether parts or all of their stock are listed or in a conservation area. This makes anticipating the need for planning permission and possible measure alternatives very difficult. Social housing providers may be able to look at their homes that were built before 1900 as a proxy for the likelihood that a home is subject to planning restrictions and/or has features that require particular technical expertise (eg cob walls, thatched roofs and bay windows). However, in reality some older homes may be relatively straight-forward whereas more energy efficient late twentieth century homes may face the planning restrictions of a conservation area.
The changes to Planning Regulations set out in the 2022 Queen’s Speech offer a mixed view for retrofit. Of concern would be that potential scrapping of Section 106 agreements. Whilst this is intended as a change for the new-build sector, it has the potential to remove one of the only mechanisms for driving apprenticeships and training for local workforces. On the positive side, ‘street votes’ and local design codes could go a long way to driving the acceptance of some measures such as EWI and solar panels that have been restricted in some areas.
8.2.4 Supply chain limitations
The Construction Leadership Council’s National Retrofit Strategy demonstrated the critical need for the upskilling of existing retrofit workforces and the need to bring at least an additional 400,000 trades people into the UK workforce in order to tackle the work required to hit Net Zero in a timely fashion. Currently there is only the SHDF which is pushing hard on targets and standards in the social housing sector, but is not in itself pushing the envelope on volume installs. Lack of supply chain is arguably the critical path problem to solve to reach a decarbonised national housing stock and there is not yet national policy addressing this.
8.2.5 Measure flexibility
The focus of funding and regulation up till now has been on the installation of ASHPs, with the underlying motive of reducing cost through scale. There has been a call for flexibility in the regulations to allow for deployment of GSHPs where they are more appropriate. GSHPs require long underground pipes, which makes retrofitting in urban environments challenging, making them more suitable to new build projects, large-scale projects feeding heat networks or areas with significant planning restrictions.
The Government is aiming to replace 1.7 million fossil fuel boilers annually by the mid-2030s. Although the target encompasses heat networks as well as heat pumps, the Climate Change Committee expects heat pumps to form the majority of these replacements. Analysis of the potential for low carbon heat networks in the UK is beyond the scope of this project, but heat networks should certainly be encouraged where resources or projects exist, or where a business case can be made. Our modelling uses heat pumps to represent a low carbon heat supply, but heat networks should be deployed where a specific project has the potential to outperform the default solution of an individual ASHP.
8.3 Technology
In this section we explore how various technological solutions could help alleviate some of the constraints social housing providers face when decarbonising their housing stock.
A lack of internal or external space is a key barrier to retrofitting small properties, so technologies such as communal heat pumps or shared loop heat pumps will have important roles to play for these homes. Whilst the installation of heat pumps is critical, the need for a thermal store/tank internally goes against the trend for removing them as gas condensing boilers have been installed over the last 15/20 years. Technologies provided by companies such as Mixergy and Sunamp for smaller heat stores using phase change materials can make this easier, but additional space is still needed. The Kensa Shoebox system may be particularly beneficial for social landlords with high rise flats, as individual units can be installed in each dwelling, preventing problems such as overheating or heat losses, and the complications of shared heating bills. Enfield Council successfully demonstrated how a shared loop system with individual Shoebox ground source heat pumps could be quickly installed in blocks of mixed tenancies whilst the flats remained occupied. Not only will this project save over 700 tCO2 annually, but tenants have saved between £450 and £700 annually on their fuel bills, bringing many occupiers out of fuel poverty.
In addition to heat pumps, we’re also seeing different electric solutions enter the marketplace which may be suitable alternatives to heat pumps for some properties. For instance, the Zero Emission Boiler (ZEB) works like a battery to store heat until it is needed, charging the internal core on time-of-use tariffs. The manufacturers state that its features will allow the ZEB to deliver grid balancing services to the National Grid in the future, reducing the cost of the boiler and helping to alleviate pressure on the electricity grid. Although you don’t get the COP saving of a heat pump.
Alternative models for heating are also emerging, which could combat carbon emissions and reduce fuel poverty under the same system. Under a Heat as a Service (HaaS) model, energy suppliers utilise customer and property characteristics to devise a bespoke heating solution for the occupier, whilst taking full responsibility for the ownership, fuel and maintenance of the heating system. The model is not based on the customer buying fuel, but instead the customer would pay an energy supplier to provide a full heating service.
We expect technological solutions like the above to play an increasingly dominant role in decarbonising the social housing sector. Whilst technology cannot solve all our problems, we believe that encouraging innovation is key to providing solutions to the challenge of reaching Net Zero by 2050.
9. Conclusions
We need a cohort of solutions to make homes easier to decarbonise, including financial incentives, regulatory changes and pushes for technological innovation.
A decarbonised home is electrically heated and has “enough” insulation
Our analysis has verified that a decarbonised home is simply one that is electrically heated, but for this to be affordable to heat it should be from a heat pump wherever possible and a reasonable level of fabric efficiency is required.
Defining “enough” insulation requires some judgement
There is not a perfect definition for every home, but the 90 kWh/m2 heat demand target used in the SHDF gives a point where fabric improvements balance out increases in costs from electrification, under current assumptions. There is no definitive level of heat demand required for a heat pump to be installed. A heat pump can provide any level of heat demand providing there is enough space and cost is no issue, but reducing heat demand will always reduce bills and emissions. A higher target is attractive from that point of view, but there is also diminishing return on investment. A less ambitious target may allow a limited budget to make a larger overall impact, but this risks needing to return to properties where insufficient work has been done first time around. Social housing providers could flex this target for different archetypes. For example, reaching a 50 kWh/m2 heat demand target is rare for houses and bungalows, even for new builds, whereas most modern flats achieve this.
Hard to decarbonise homes may look very different to each other
A hard to decarbonise home is one in which its, location, structure, or history present barriers to electrify its heating and sufficiently improve its energy efficiency to make it comfortable and affordable to heat. A home can have a range of factors that might prevent it from being decarbonised to the levels required to hit Net Zero without being very expensive to heat. These range from technical characteristics like having a high form factor and space constraints to external factors such as planning restrictions in conservation areas. The hardest to treat homes are when these barriers combine.
Some homes fail to reach a fabric efficiency target
Decarbonising the heating system may then be challenging without increasing tenant bills. Our modelling finds 2 per cent of homes that fail to reach a heat demand target of 90 kWh/m2. This is not an absolute target for affordability, but it is telling to see that a small proportion look to be unable to reach it without more bespoke interventions than we have modelled. Then there are homes that can reach the target but require an investment that is hard to justify. 5 per cent of properties have required investments to reach Net Zero of greater than £20,000 in our analysis. Required investment will vary with size and condition of the home, but this indicates a reasonable minority where funding is likely to be a major challenge to lowering heat demand sufficiently. There are also homes that are unable to reach a target without relying on measures restricted by other limits, such as planning restrictions.
Changes are required to make hard to treat social homes easier to decarbonise
Selling or even demolishing hard to treat homes significantly affects tenants but also will not help UK housing meet its Net Zero requirements. We need a cohort of solutions to make homes easier to decarbonise, including financial incentives, regulatory changes and pushes for technological innovation.